Release 45 Notes 23 March 2025#
Summary#
In this release, we’ve developed the following improvements:
In Trend Forecasting:
New option to select predefined future date ranges (e.g., Next Week, Next Month),
Ability to change widget parameters directly in the side panel,
New button to copy widget name to the clipboard for easy addition to the dashboard,
Ability to Run a Forecast from Side Panel,
Insight widgets are now visually identified with a badge.
In Chart Designer:
X and Y axis titles can be aligned left, right, center, top, or bottom,
Scale breaks added by default to improve chart readability,
Legends are now hidden by default in charts with only one series.
In Labor Module:
Save Grid State” button allows saving custom grid settings,
Measured activities are no longer split incorrectly when inserting indirect tasks.
Other Improvements:
Easier to fill-out Account Creation Page,
Pivot table exports now include total row in Excel and CSV,
New button resets dashboard to its last published state.
Trend Forecasting Improvements#
Trend Forecasting Added to Admin Tools#
Trend Forecasting is now available as an option in the Admin Tools navigation menu for all users.
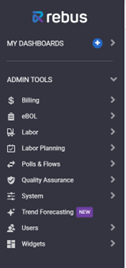
If you have not yet purchased Trend Forecasting, clicking on this item directs you to an info page where you can learn more about Trend Forecasting or request a demo.
Relative Range Date Picker for Future Prediction Dates#
There is now a Relative Range Date Picker for future prediction dates in Trend Forecasting. In the Create / Edit panel in the General tab, under the ‘Prediction Date Range’ label, you can now select from a list of future relative date ranges. For example, this includes Tomorrow, End of Day, Next X Days, Next Week, Next Month, etc.
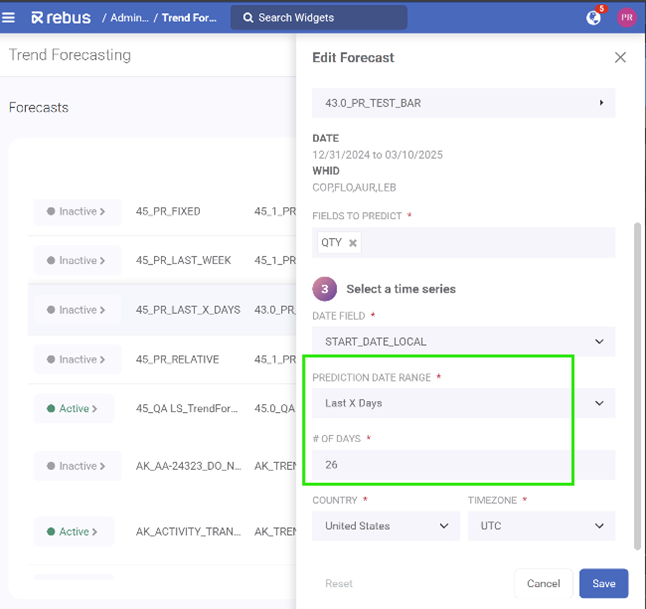
Previously, you had to manually select a date range using the calendar function.
Overriding a Widget’s Parameter Values#
You can now override a widget’s parameter values when you edit a forecast in Trend Forecasting. This makes it possible for you to edit widget parameters without navigating away from the Trend Forecasting screen. In the side panel General tab, first select your widget, then you can modify the parameters listed. You can also reset the default widget parameters by clicking the link.
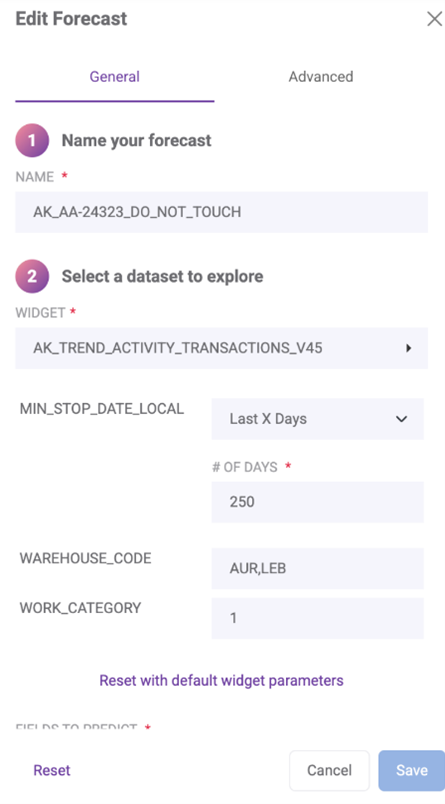
You can’t make any changes to widget parameters if a forecast is active. Previously, you had to modify any widget parameters from the Widget Properties form from the dashboard or Widget Builder.
Copying to Clipboard for Insight widget#
When you automatically generate an insight widget using a forecast, there is a new button that lets you copy the widget name to the clipboard. This means that you will no longer have to manually scroll, find and copy the widget name after generating it, and you can easily add it to your dashboard.

The Trend Forecasting Results screen now updates immediately when you view results for a generated forecast or run a forecast. The Status, Run Forecast button, Date Dropdown, and Results Grid all automatically update. Previously, there was a delay in the refresh results when you ran a forecast or viewed results.
Faster Results Screen#
The Trend Forecasting Results screen now updates immediately when you view results for a generated forecast or run a forecast. The Status, Run Forecast button, Date Dropdown, and Results Grid are all automatically updated. Previously, there was a delay in the refresh results when you ran a forecast or viewed results.
Running a Forecast from Side Panel#
In the side panel when you create or edit a forecast, there is now a Run Forecast button that allows you to run an active forecast when selected.
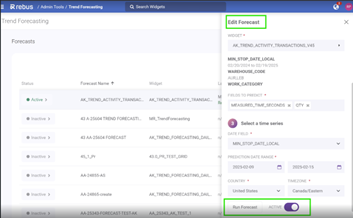
You can also now activate a forecast directly from the Edit Forecast panel. Next to the Run Forecast button, there is a toggle that allows you to switch your forecast from Inactive to Active, and vice versa. These updates let you take actions immediately from the Edit Forecast panel after creating or editing a forecast. Previously, you had to save and close the edit panel and separately activate and run a forecast. You can still perform these actions outside of the Edit panel.
Adding a Badge to Insight Widgets#
Insight widgets on dashboards are now identified with a badge. This makes it easier to know at a glance which dashboard widgets are insight widgets. Insight widgets are widgets that are automatically generated in Trend Forecasting.
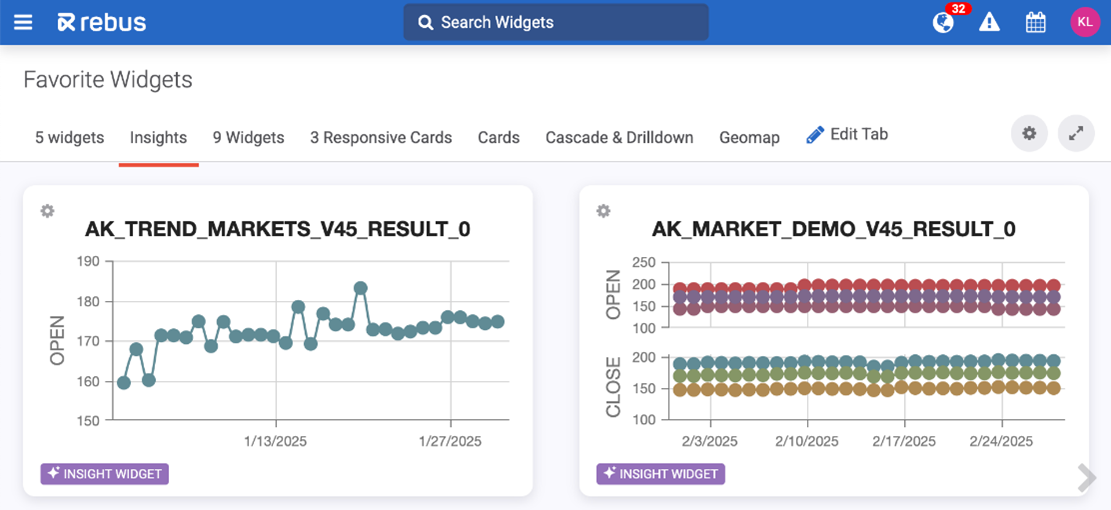
Previously, the only way to know if a widget was an insight widget was to navigate to Widget Builder and check if the widget is in the REBUS TREND FORECASTING widget group, or search for the widget and check that the Data Source is Rebus Trend Forecasting Automated Widget Results.
Copying/Cloning Forecast Pipeline#
You can now clone your existing forecasts in Trend Forecasting. Previously, you had to build every forecast from scratch. Now you can quickly create variations of existing forecasts without starting from the beginning.

Give a name to your cloned forecast.
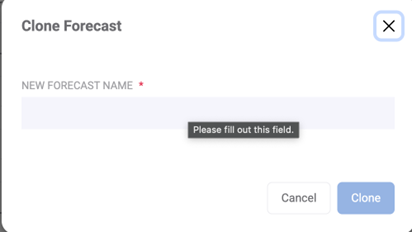
You can then make any desired edits to the new forecast.
Improvements - Chart Designer#
Aligning Axes Titles to Top/Bottom/Left/Right#
You can now choose the alignment for your X and Y axis titles in the redesigned Chart Designer. When you’ve selected the fields for your X and Y axis, you can then choose your axis Titles. In this section, you can also select the titles’ alignments.
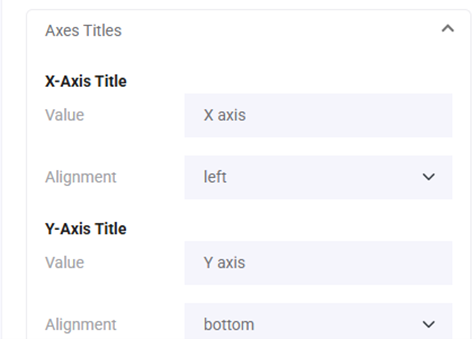
Previously, X and Y axis titles were automatically centered. You can choose to align the titles to the left, right, or center of the X axis, or the top, bottom, or center of the Y axis.
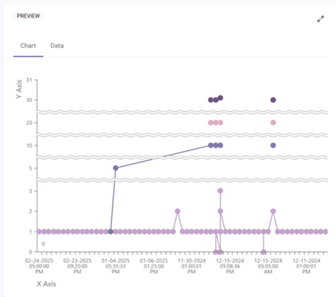
Adding Scale Breaks by Default#
Charts in the redesigned Chart Designer now automatically add scale breaks. When a chart’s dataset varies significantly in values, you often end up with bars that are too small to see or to click on because of an outlier. Scale breaks are intentional breaks on the y-axis that are most often used to redistribute data points on a chart. This feature improves readability when there are large differences between the high and low values of the data being plotted. Scale breaks let you visualize outliers without compromising the entire chart.
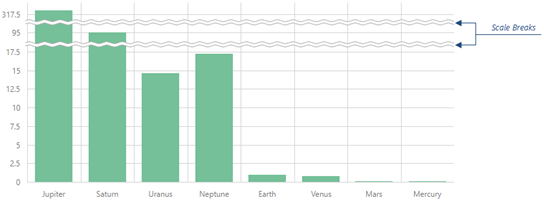
This change affects the following chart types:
bar
line
area
spline
bubble
range
Scale breaks only apply to numeric data. They are automatically calculated based on the series data. A chart can have up to 4 scale breaks.
The change is enabled for both new and existing widgets. Existing widgets will be updated with scale breaks only when opening the widget in the new Chart Designer screen.
Previously, in the Legacy version of Chart Designer, you could only set Visual Range start & end values. However, a static range like this may no longer be relevant when you change date ranges or other filters in the widget itself on the dashboard. You can still use this function in Legacy.
Legend ‘off’ by default#
The Legend is now hidden by default in the redesigned Chart Designer, which streamlines the design process for charts with only one series, which are the most common. In charts with only 1 series, a Legend is unnecessary.

Previously, the Legend was set to display by default, and you had to select the checkbox to remove it.
This affects the following chart types:
Bar/Line/Area/Spline
Range
Bubble
You can still add a Legend to these chart types by clicking the ‘Show’ checkbox.
Improvements - Labor Module#
Saving Grid on Transaction Error Page#
On the Transaction Error Review page, there is a new Save Grid State button that lets you save any changes made to your grid, such as reordering or changing the size of your columns, when you reset or make other changes in the fields section.
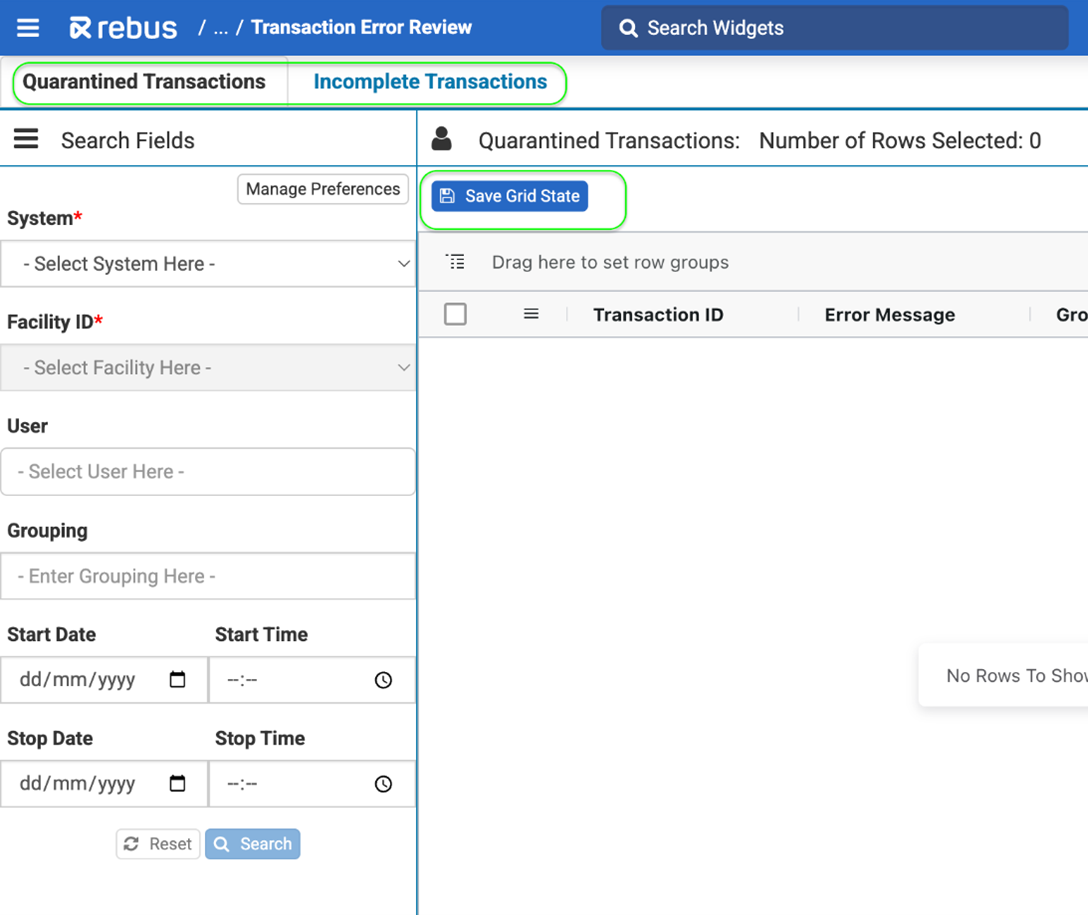
Previously, you would have to repeatedly re-order and group the grid after any Deletes or Resolves.
Inserting Indirect or Signoff/Splitting Activities#
Measured activities are no longer split when inserting indirect activities or Sign On/Offs in the Activity Adjustment Admin. Previously, when you inserted an indirect activity or Sign On/Off into a measured activity, the measured time was getting duplicated, which meant total hours were overstated in reports and widgets. Now, measured time reflects the actual duration between the start and stop times of each section. For example, if you have a 5-minute activity, and an indirect task is inserted 3 minutes in, the correct breakdown is:
First part: 3 minutes (measured time)
Indirect activity: 1 minute (unmeasured time)
Improvements - Other#
Improved Account Creation Page#
There are several new updates to the Account Creation page that make it more user-friendly and faster to fill out.
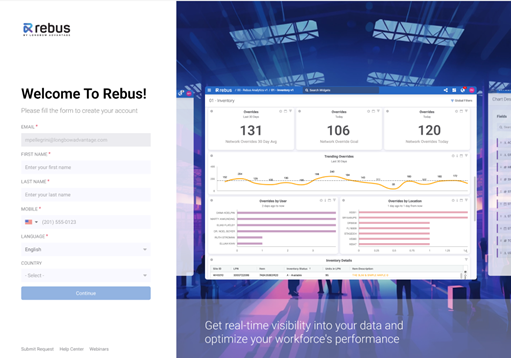
The Language Field is now auto-populated with English.
The Country Field is now optional.
The Verification Code step has moved closer to the end of the form.
You can now show/hide your password during signup.
Password rules and a password strength bar are updated in real-time to provide you with immediate feedback.
Once you’re done creating your account, click Access Rebus and you’ll immediately be logged in without having to re-enter your credentials a 2nd time.
Including Total Row in Widget Export#
Now when you export data from widgets with pivot tables, the Total row is included in the export in Excel & .csv. Previously when exporting grids with pivot functionality, Total rows did not appear in the exported file.
Resetting Dashboard Layout#
A new button has been added to dashboards that resets your dashboard layout to its last published state. This means that you can drill down, resize, and compare widgets on the dashboard without losing your original layout.
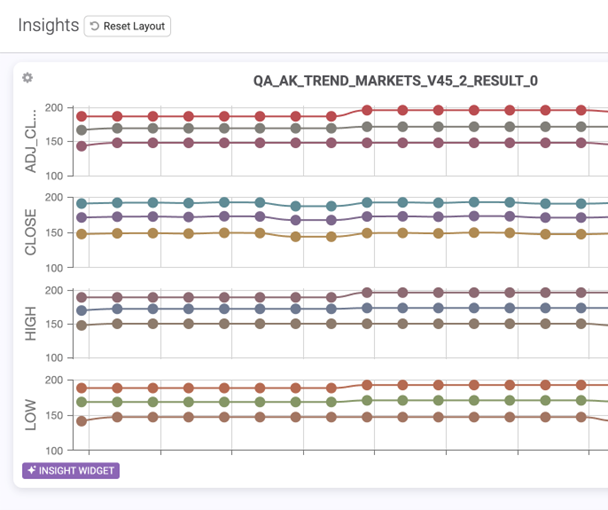
Previously, if you re-sized or drilled down widgets on your dashboard, you would have to manually reset them to return to the state they were in previously.
New Bulk Replace Insert Type in Flow Designer#
In Flow Designer, you can now replace documents in bulk. There is a new Insert Type for the WRITEOUTPUT Step on the Step Details screen called Bulk Replace. Select it from the Insert Type dropdown.
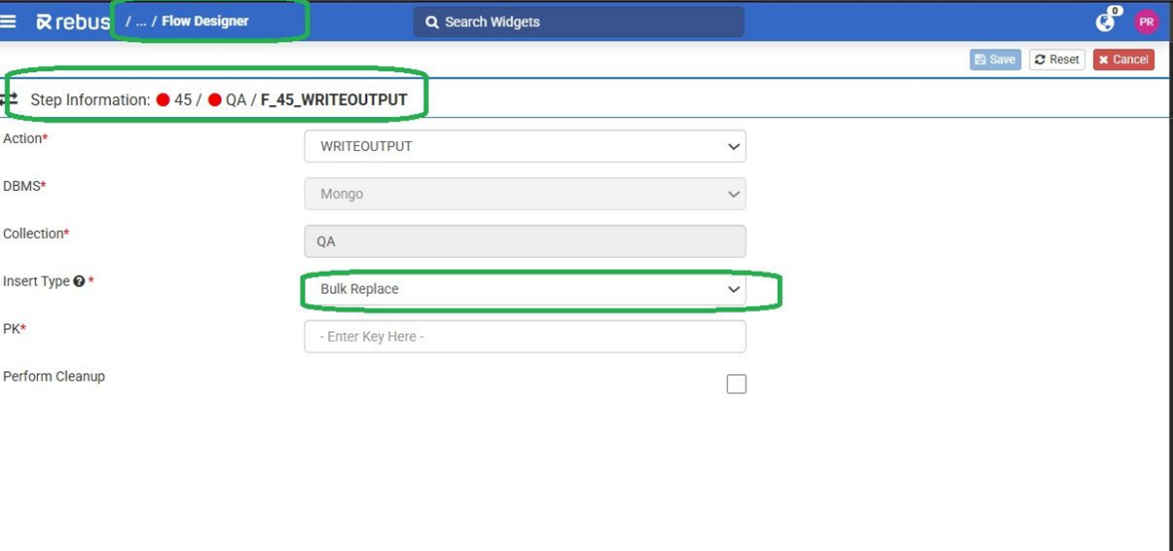
Bulk Replace behaves similarly to Replace Document, but processes, deletes, and then inserts in batches, rather for each document. Previously, you could only use Replace Document, which processed documents individually.
Bug Fixes#
Dashboard Publisher – Relax restrictions if publishing configuration is absent
Activity configuration admin- User is thrown 404 Error Message while creating a duplicate activity
Chart Designer: Super Widgets - Bar padding not persisting to dashboard or to legacy chart designer
Labor Preferences-Labor Teams - Facility dropdown has a value, when only System and No Facility is selected as default values
Global Filters- Name options in global filters are not displayed/disabled in the case of published/shared dashboards