Labor Planning Concepts#
To set up the Labor Planning Module effectively, learn about the Labor Planning Module’s concepts:
How Labor Planning Works#
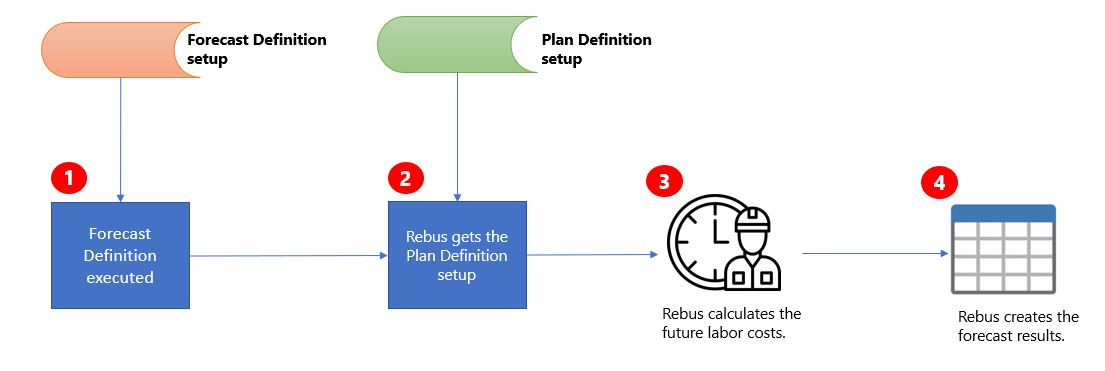
Here’s a high-level overview of how the Labor Planning Module works:
A Forecast Definition is executed automatically or manually.
Rebus gets the Plan Definition setup that contains the information necessary to calculate the future labor costs.
Rebus creates the forecast results that include:
The future demand quantities
The future demand quantities associated with the activity
The forecasted measured and goal times
The productivity (%) based on the historical productivity
How Rebus Calculates Labor Costs#
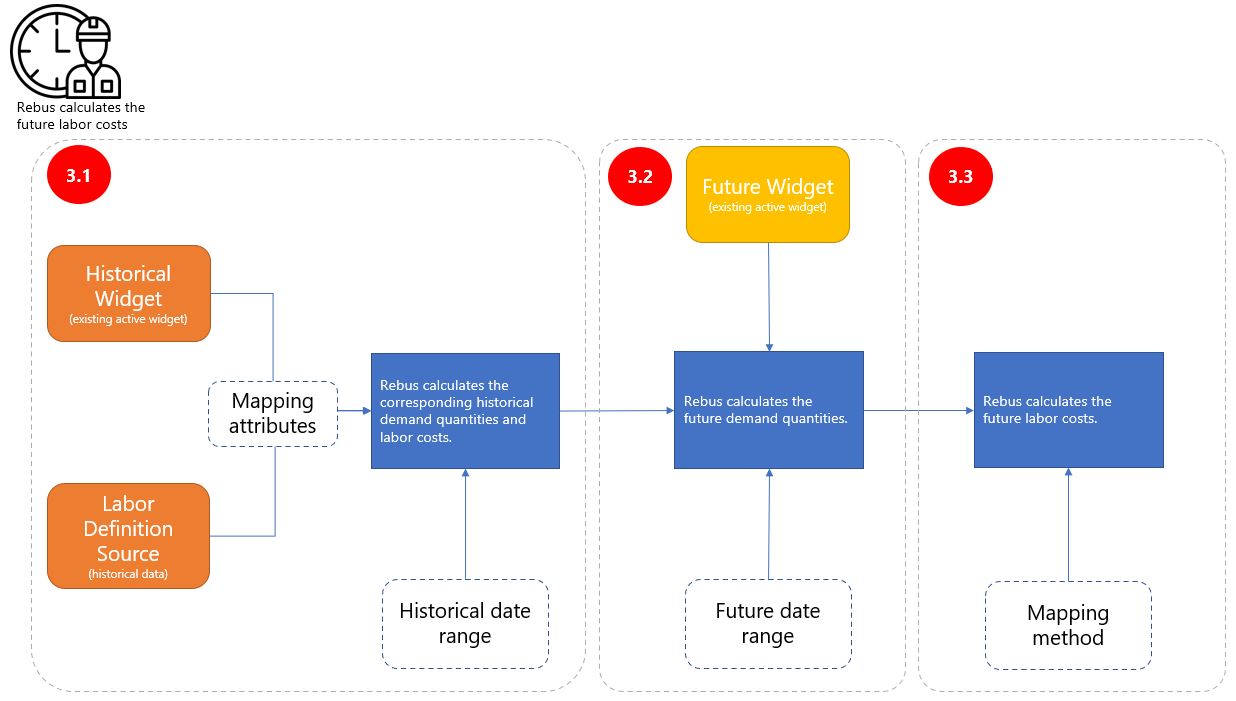
This section breaks down step 3 of How Labor Planning Works to explain how Rebus calculates future labor costs:
3.1. Based on the mapping attributes and the historical date range, calculates the corresponding historical demand quantities and labor costs from respectively the Historical Widget and the Labor Definition Source. 3.2. Based on the future date range, calculates the future demand quantities from the Future Widget—an existing active widget. 3.3. Finally, calculates the future labor costs according to the mapping method.
Demand Types#
A Demand Type is a setup that classifies a given demand. A demand is any type of work that requires labor costs from warehouse staff to complete it. Examples of a demand include outbound orders, inbound receipts, work orders, production, directed tasks, etc. An example of a Demand Type is one you would name ‘Outbound Orders’ to classify the outbound orders demand.
A Demand Type comprises three key elements:
Historical Widget
Future Widget
Demand Attribute fields
Historical Widget#
The Historical Widget is used to get the total historical quantities of a given demand. It’s populated with data imported from your WMS and therefore captures historical and current data about the demand. For more information about the type of data that this widget must include, see Demand Attribute Fields.
Future Widget#
The Future Widget is an existing widget used to get the total future quantities of a demand. A future widget can be either:
An active widget populated with data records imported from your WMS. It contains data about an upcoming demand. It could be the same widget that’s assigned as the Historical Widget. If the widget does not contain enough future demand quantities, you can manually add more when executing a forecast. Manually adding demand quantities does not affect the widget’s current data.
Tip
You can build a Future Widget based on the same Historical Widget’s database source and add to it a scale factor parameter. Doing so calculates accurate forecast results by multiplying the historical demand quantities by that scale factor. For more information, see Labor Planning - Applying a Scale Factor to Forecast Definitions.
An active widget populated by a custom data entry form used for what-if type of planning. The Custom Data Entry form contains forecasted data about the demand based on a study of historical data and patterns.
Important
The future widget must have the same field names and types as the ones in the Historical Widget. You can verify the Historical Widget’s field names and types in the Field Stage of the Widget Builder.
Demand Attribute Fields#
The Historical Widget must include at least the fields you want to use for:
Mapping activities to their demand. Mapping fields must be in both the Labor Definition Source and the Historical Widget to associate the activities to their respective demands(s). This is further explained in Mapping Attributes.
Optional: Grouping the future demand quantities.
Units—The field(s) holding the demand quantities.
Important
The Units field must have the same name as the UOM values used in your Labor Definition Source.
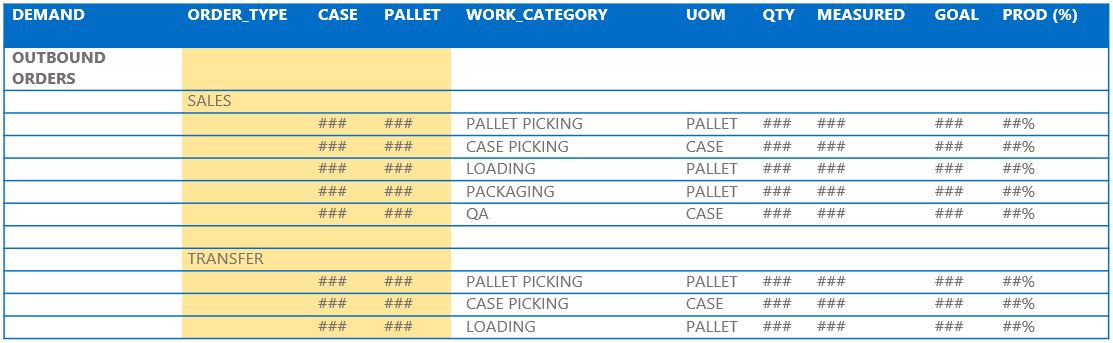
Rebus uses the Demand Type’s grouping fields to determine how future demand quantities will be presented in the forecast table. In the below example, the units (i.e., demand quantities) are CASE and PALLET, and are grouped by ORDER_TYPE.
Labor Definitions#
A Labor Definition is a setup that groups one or many activities. An activity is a work task, or an event performed by warehouse staff and accounted for in your warehouse operation’s schedule. A Labor Definition comprises two key elements:
Labor Definition Source
Labor Metadata
Labor Definition Source#
A Labor Definition Source is used to get the total historical labor costs for a given demand. It captures current and historical data about one or more activities.
The data source is different according to your situation:
I’m using… |
The Labor Definition Source is… |
|---|---|
Rebus’ Labor Module |
Your standard labor collection. This data source contains by default all existing data about your activities. Therefore, you can set up only one Labor Definition in the module. |
LMS integrated with Rebus |
A custom widget that captures data about one or more activities. If you don’t have one that captures all activities, you may need to configure more than one Labor Definition. Important Custom widgets must have at least the following fields:
|
Labor Metadata#
After determining the Labor Definition Source for a Labor Definition Source, you then define the fields for:
Optional: Grouping the forecasted labor costs.
The unit of measurement (UOM).
Calculating the quantity value of the UOM field.
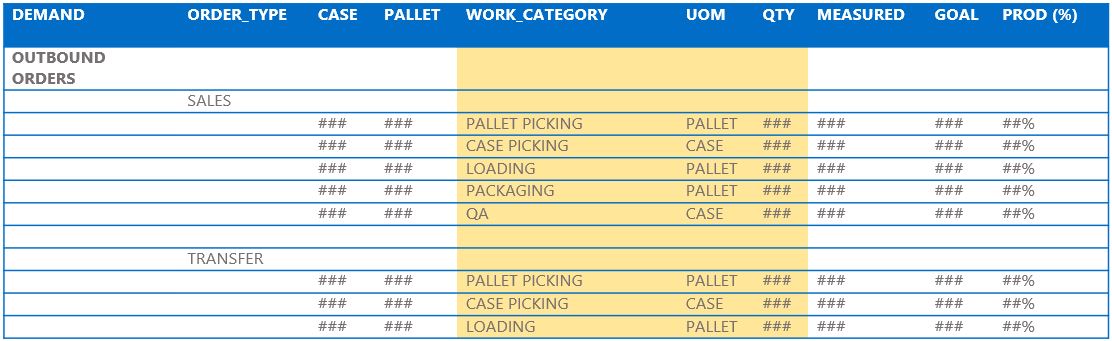
With the labor metadata, the Labor Definition determines how the future labor costs will be presented in the forecast table. In the below example, the labor costs are grouped by WORK_CATEGORY, the UOM field is UOM, and the field used for calculating the quantity of the UOM field is QTY.
Plan Definitions#
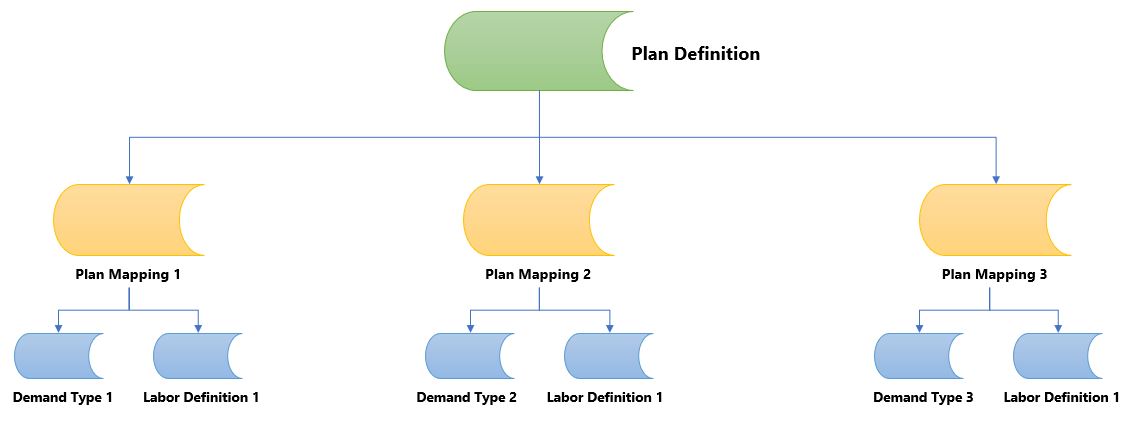
A Plan Definition must hold all demands and all possible activities for which to forecast the labor costs. It does so by holding a collection of Plan Mappings that associate Demand Types and Labor Definition(s) and that use mapping attributes to associate the demand to relevant activities. Plan Mappings also define the mapping method.
Mapping Methods#
A mapping method determines how future labor costs are calculated. Two mapping methods exist in a Plan Definition:
Mapping Method |
Description |
Use it When… |
|---|---|---|
Historical Demand |
Calculates future labor costs proportionally to the demand volume. For example, in the past, it took 100 hours to fulfill an order of 1000 pallets. Based on this information, it can be estimated that it would take 50 hours of work to fulfill an upcoming order of 500 pallets. |
There are historical trends between labor costs and a demand. |
Fixed Percentage |
Calculates labor costs of only a percentage of the future demand quantities. For example, labor costs for the ‘quality assurance’ activity is calculated for 30% of outbound order quantities. The percentage is user-defined. |
You meet one or more of the following conditions:
|
See also
Mapping Attributes#
Mapping attributes are conditions you set up to get the most precise forecast results. The table gives an overview of the types of conditions that can be set up and the purpose of each. As shown in the table, both types of conditions let Rebus calculate the total historical labor costs.
Set up conditions that… |
So that… |
|---|---|
Identify specific activities |
Rebus calculates the total historical labor costs of only the data matching these conditions. |
Associate the demand to these specific activities |
Rebus calculates the total historical demand quantities and labor costs of only the data matching these conditions. |
In the next sections, we’ll cover the answers to the following questions:
Question |
Section |
|---|---|
How do mapping attributes identify specific activities? |
|
How do mapping attributes map a demand to these specific activities? |
|
How does Fixed Percentage calculate future labor costs? |
|
How does Historical Demand calculate future labor costs? |
Constant Values#
You can assign constant values to a given activity’s attribute fields to identify it in Rebus. For example, as part of completing an outbound order, we want to plan enough hours of full inventory moves. Consider the following Labor Definition Source:
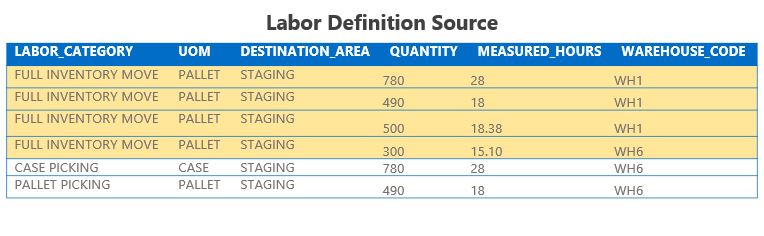
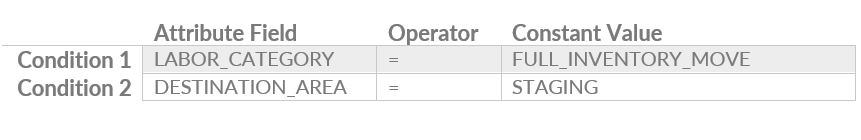
As a result, we could set the following conditions that map these attribute fields with these constant values:
Common Attribute Fields#
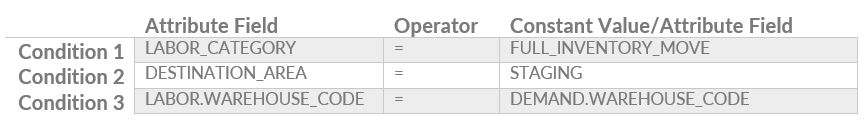
You can associate activities to their demand using one or more common attribute fields that affect the amount of labor costs. For example, the warehouse can affect the amount of labor costs necessary to complete a demand. Consider the following Labor Definition Source and the Outbound Orders Historical Widget:
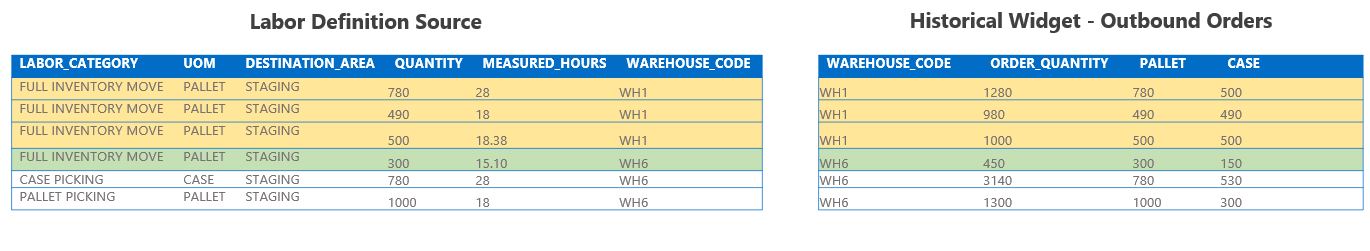
As a result, we could set condition #3 to map the FULL_INVENTORY_MOVE activities to outbound orders using the WAREHOUSE_CODE attribute field:
How Fixed Percentage Calculates Future Labor Costs#
Fixed Percentage is a mapping method that calculates labor costs of only a percentage of the future demand quantities.
The percentage is user-defined.
Consider the following Labor Definition Source, and Outbound Orders Historical Widget:
Here’s an overview of how Rebus calculates future labor costs:
Event Sequence |
Rebus Processing Notes |
|---|---|
1 |
Rebus receives from the Future Widget an upcoming outbound order of 2000 pallets in WH1. Mapping attributes:
|
2 |
Rebus identifies:
|
3 |
Rebus calculates the average historical time measurement for full inventory moves matching the attributes in event sequence #2 ≈ 2.18 min/pallet |
4 |
Fixed percentage = 30% of ordered pallets would through full inventory moves. |
5 |
Rebus calculates the order quantity to be processed by full inventory move: 2,000*30% = 600 pallets |
6 |
Rebus calculates the future labor costs in hours: (2.18*600)/60 = 21.8 hours |
7 |
Rebus forecasts 21.8 hours of full inventory move to allocate in WH1 for the upcoming outbound order of 2,000 pallets. |
How Historical Demand Calculates Future Labor Costs#
Historical Demand is a mapping method that calculates future labor costs proportionally to the demand volume. For more information, see Mapping Methods.
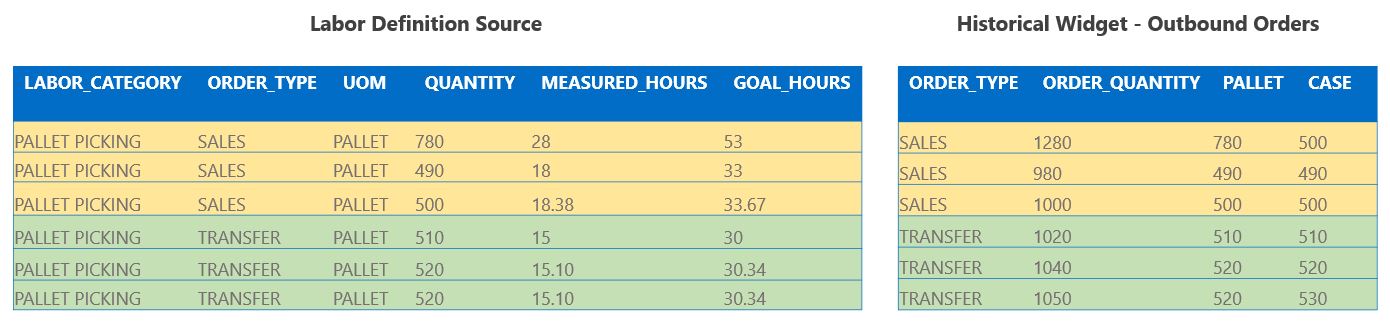
Consider the following Labor Definition Source and Historical Widget of Outbound Orders:
Here’s an overview of how Rebus calculates future labor costs:
Event Sequence |
Rebus Processing Notes |
|---|---|
1 |
Rebus receives from the Future Widget an upcoming sales order of 2,000 pallets. Mapping attributes:
|
2 |
Rebus identifies:
|
3 |
Rebus calculates the historical labor costs and demand quantities matching the attributes in event sequence #2:
|
4 |
Rebus calculates the future labor costs: (64.38*2,000)/1,770 = 72.75 hours |
5 |
Rebus forecasts 72.75 hours of pallet picking to complete the upcoming sales order of 2,000 pallets. |
Note
Event sequence #4 calculates the labor costs with a mapping strength of 100% because all pallet picking activities attributed to a sales order are necessary to calculate future labor costs.
See also
Mapping Strength#
A mapping strength is a percentage value you define to adjust the calculation of future labor costs, based on the specific requirements of a particular type of demand. The value must be a percentage between 0% and 300% inclusive. Here’s a list of examples where you might want to use a mapping strength different than 100%:
Considering labor costs of indirect activities. For example, if data shows that 100 hours were spent on the “full inventory move” activity last month, you might want to estimate the future labor costs specifically related to outbound orders. Based on prior experience, you could allocate 30% of the expected labor costs for the “full inventory move” activity to outbound orders.
An activity needs to occur on different days before a demand’s completion date. As a result, you could set up different mapping strengths with an offset each. For example, case picking could occur on different days before a trailer dispatch for an outbound order:
Offset
Mapping Strength
One day before the trailer dispatch.
80% of case picking total hours will be allocated for completing the outbound order.
On the same day of the trailer dispatch.
20% of case picking total hours will be allocated for completing the outbound order.
See also
Here’s an overview of how Rebus calculates future labor costs with a mapping strength different than 100%:
Event Sequence |
Rebus Processing Notes |
|---|---|
1 |
Rebus receives from the Future Widget an upcoming outbound order of 2000 pallets.. Mapping attributes:
|
2 |
Rebus calculates the historical labor costs and demand quantities:
|
3 |
Mapping strength = 30% |
4 |
Rebus calculates the future labor costs: [(40*2000) / 4000] * 0.30 = 6 hours |
5 |
Rebus forecasts 6 hours of full inventory move to complete the upcoming sales order of 2000 pallets. |
Offset#
In a Historical Demand mapping method, you must specify an offset to indicate when an activity starts and ends to complete a demand. That way, the offset sets a time frame for the activities.
Example: A historical pattern shows that case picking occurs one day before the outbound order’s trailer dispatch date.
Event Sequence |
Rebus Processing Notes |
|---|---|
1 |
The historical time frame for calculating the historical demand volume and the labor costs is March 1st 2022 to March 31st 2022 |
2 |
Case picking occurs one day before the trailer dispatch date. |
3 |
The time frame in which Rebus calculates historical labor costs for case picking is February 28th 2022 to March 31st 2022. |
Forecast Definitions#
A Forecast Definition is Labor Planning’s tool to forecast the labor costs for a demand.
A Forecast Definition includes:
The Plan Definition
The labor utilization percentage, i.e., the percentage of total time warehouse staff is spending in essential activities.
The frequency at which the Forecast Definition will run.
The historical parameters for which to calculate the total historical demand volume and labor costs. Such parameters are:
The historical date range (yesterday, last week, last month, last year, etc.).
Any other parameters. For example, you could choose a specific facility for which you want to calculate the historical demand volume and labor costs.
The forecast parameters for which to calculate the total future demand quantities and labor costs. Such parameters are:
The future date range (tomorrow, next week, next month, etc.).
Any other parameters. For example, you could choose a specific facility for which you want to determine the upcoming demand volume and the estimated labor costs.
Note
The historical and forecast parameters that you want to use must be set up in the widgets’ Filter Stage of the Widget Builder.
Moreover, to evaluate and compare multiple forecasts’ accuracies, you can set up multiple Forecast Definitions differently. For example, you can set up Forecast Definitions that have:
A different historical date range.
A different Plan Definition where one uses a Fixed Percentage, and another uses Historical Demand mapping method.