Planning Labor Costs#
After setting up Labor Planning, follow these procedures to learn how to forecast and plan the allocation of labor costs:
Executing Forecast Instances#
By using the Forecast Definition you’ve created, you can either execute a forecast instance manually or let it run automatically based on its schedule. After execution, the forecast results are generated. This section goes over consulting the forecast’s screen and its results.
Steps#
From the Rebus menu, select Admin Tools > Labor Planning > Forecast Execution. You are at the Forecast Execution screen. On the left panel, the Forecast Execution screen displays a list of inactive and active Forecast Definitions.
From the left panel, select the desired active Forecast Definition.
Optional: To execute the forecast manually, click ‘Execute’.
Result#
The forecast instance is created in the Forecast Instances table, and goes through the statuses of Scheduled, In Progress, and Complete. The time it takes for the forecast instance to reach the Complete status depends on how far back Rebus collects and calculates historical data (e.g., last week, last month, last year, etc.).
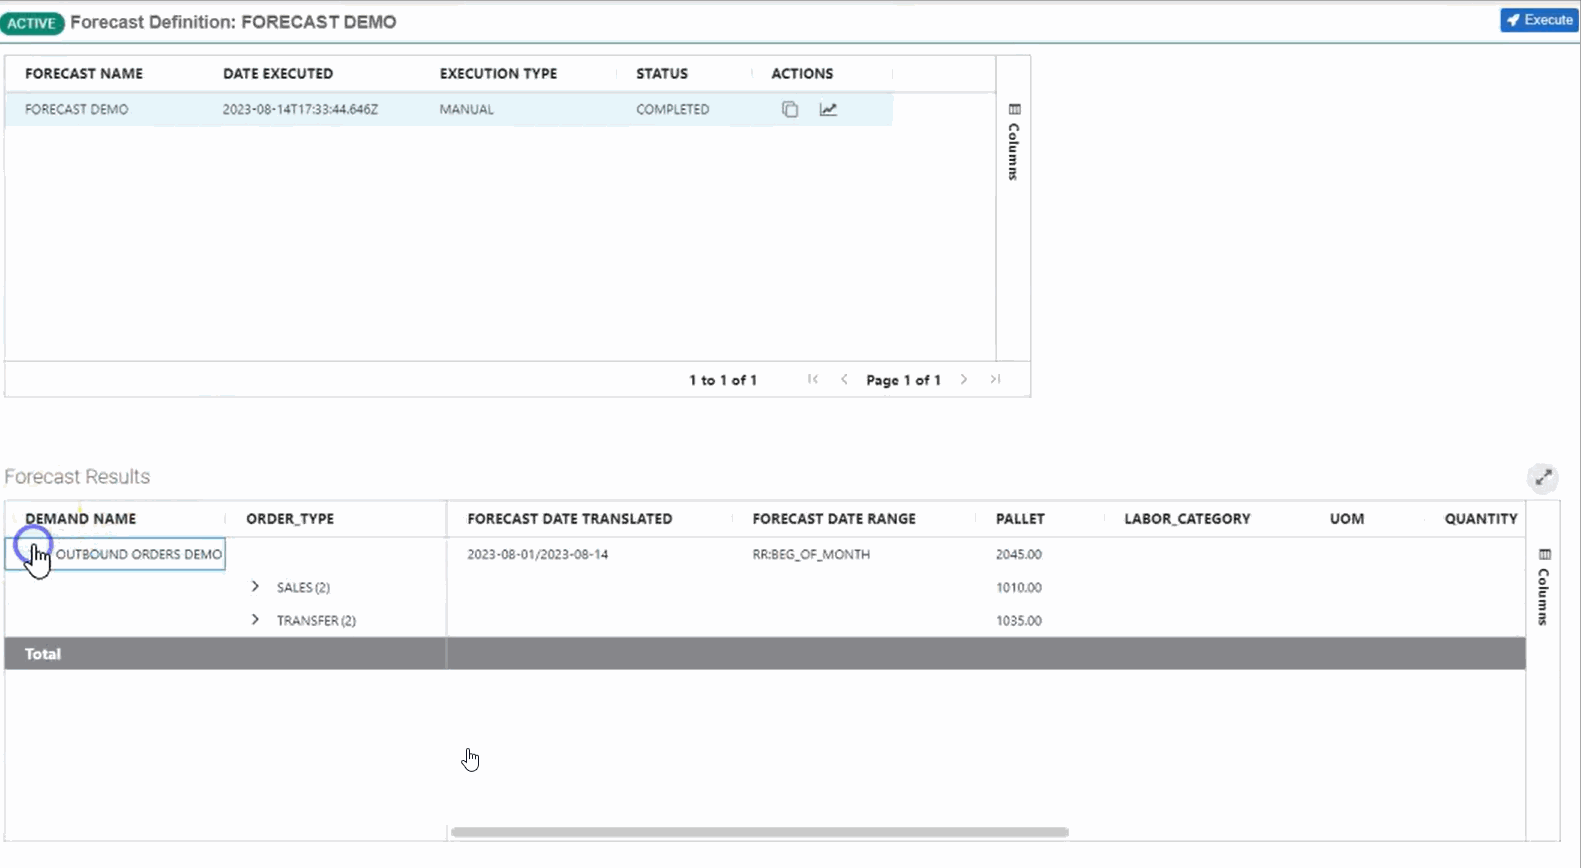
Once the forecast instance reaches the Complete status, you can display the forecast results by selecting the forecast instance. The forecast results appear in the Forecast Results table by clicking the chevron ![]() . For more information, see Forecast Tables.
. For more information, see Forecast Tables.
Forecast Tables#
This section goes over what each table displays in the Forecast Execution screen.
Forecast Instances Table#
The Forecast Instances table shows various information about all forecast instances of the selected Forecast Definition. This section covers in detail the information in this table.
Table 1: List and Description of Each Column in the Forecast Instances Table
Column Name |
Description |
|---|---|
Forecast Name |
The Forecast Definition’s name. |
Date Executed |
The date the Forecast Definition was executed. |
Execution Type |
See Table 2: List and description of each Execution Type |
Status |
See Table 3: List and description of each Status |
Actions |
The actions you can do in a forecast instance: |
Table 2: List and Description of Each Execution Type
Column Name |
Description |
|---|---|
Automatic |
A forecast instance that runs automatically according to its scheduled time. |
Manual |
A forecast instance that runs after executing it with the ‘Execute’ button. |
Cloned |
A forecast instance that runs after cloning it from another instance. |
Table 3: List and Description of Each Status
Column Name |
Description |
|---|---|
Scheduled |
A forecast instance to be executed according to its scheduled time. ‘SCHEDULED’ is the initial status of all instances, regardless of their Execution Type. |
In Progress |
A forecast instance that is calculating forecast results. At this status, the forecast results are not displayed. |
Complete |
A forecast instance that finished calculating the forecast results. At this status, the forecast results are displayed. |
Error |
A forecast instance that was executed but has an error. To know the reason of the error, hover over the exclamation mark |

Forecast Results Table#
In summary, the Forecast Results table displays the upcoming demand volume and the forecasted labor costs (i.e., the measured and goal times). The table groups the upcoming demand volume and the forecasted labor costs according to the fields you have defined as:
Output and Unit in the Demand Types.
Output, UOM, and Quantity in the Labor Definitions.
Moreover, the table displays two last columns:
Column Name |
Description |
|---|---|
Original Productivity % (ORIG PROD %) |
The original productivity percentage that is calculated based on the historical date range. |
Adjusted Productivity % (ADJ PROD %) |
You can adjust the productivity. To do so, click the ‘Edit’
|
Next#
Cloning and Modifying Forecast Instances#
You can clone an existing forecast instance and modify it to manually input forecasted data for a demand. You might want to do this when your Future Widget does not contain enough data imported from your WMS.
You can do one or more of the following actions:
Delete a forecasted demand’s records.
Update a forecasted demand’s quantities.
Create a new demand and its demand quantities.
Edit the mapping strength only for the cloned forecast instance.
Note
You can clone and modify a forecast instance only if there are no in-progress instances.
Steps#
Under Forecast Instances, select the desired forecast instance to clone and modify, and click the ‘Clone and Modify Instance’
 button. The Edit Forecasted Demands form appears.
Do one or more of the following actions available in the form.
Delete demand records
From the Edit Forecast Demands form, find the demand record, and under the ‘Actions’ column, click the ‘Delete’
 button.
Update forecasted demand quantities
From the Edit Forecasted Demands form, select the demand record. The Update a Demand form appears below.
Next to ‘Quantity Fields’, enter the new demand quantities for each of the demand’s unit fields.
Click ‘Update’. You’ve updated the demand quantity.
Create new demands and quantities
From the Edit Forecasted Demands form, Click ‘+ New Demand’. The Creating a Demand form appears.
From the dropdown, select the demand for which you want to add quantities.
Fill in the rest of the fields. See the table below that lists each field and what to do next to it.
Field
What You Enter…
Demand Output Fields
Enter the desired values for the demand’s output.
Quantity Fields
Enter the desired values for the demand’s unit fields.
Click ‘Save’.
Click ‘Next’. The Edit Plan Mappings form appears.
Optional: Edit the Plan Mapping’s mapping strength. To do so, follow these steps:
From the Edit Plan Mappings form, find the Plan Definition to edit the fixed percentage or the mapping strength.
Under the STRENGTH % column, double-click the field or click the ‘Edit’
 button.
Enter the new mapping strength percentage and click anywhere outside the field or press the ‘Enter’ key.
Click ‘Done’.
Result#
You have cloned an existing forecast instance and modified it to create a new Forecast Instance. This new forecast instance has the status ‘SCHEDULED’ and the execution type ‘CLONED’.
Tracking Demand and Labor Progress#
This procedure goes over tracking the progress towards completing the different demands. You can track in real-time the forecast’s progress by comparing your actual results against the forecast results. That way, you can assess where potential staffing adjustments could be made in your labor operations.
Execution Status#
The execution status is displayed to the left of the Track button along with the date of the last successful execution. If there is a tracking failure, an error message will be displayed.
If the tracking demand was successful, the message will say COMPLETED.
Automated Progress Tracking#
Set up a forecast instance so that tracking executes automatically and its progress tracking tables are automatically refreshed every 10 minutes with current data. On the Forecast Execution screen, each forecast instance’s Actions field has a new star item. It has three states, which you can toggle through by clicking the star:
Empty star - Disabled. Tracking has never been enabled on this instance.
Gold star - Enabled and Tracking. Progress Tracking tables are generated for the forecast instance and they are refreshed with current data every 10 minutes.
Grey star - Previously tracked forecast instance whose tracking is now disabled.
To enable tracking on a forecast instance, all the following must be true:
No other forecast instance has tracking enabled.
The forecast instance status must be completed.
The forecast instance’s date range is 7 days or less.
The forecast end date has not yet passed.
Initiating Progress Tracking#
This procedure goes over initiating progress tracking to generate progress tracking data.
Steps#
If you’re already at the Forecast Execution screen, go to step 3.
From the Rebus menu, select Admin Tools > Labor Planning > Forecast Execution. You’re at the Forecast Execution screen.
From the left panel, select the Forecast Definition.
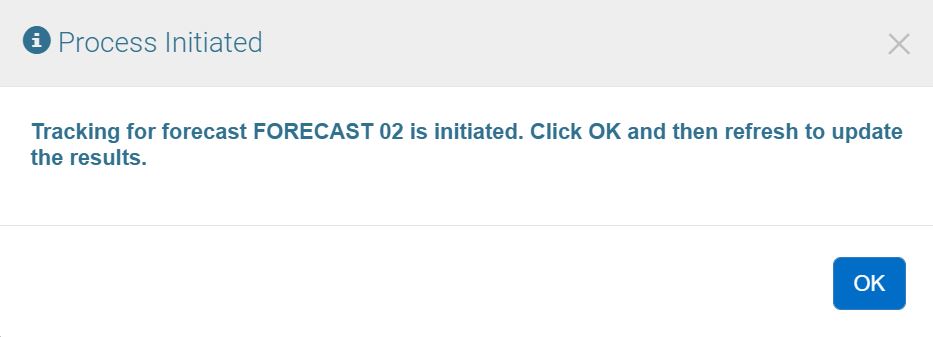
Under Forecast Instances, find the forecast instance to track progress for, and click the ‘Track Progress of Forecast Instance’
 button. A new page appears with two temporarily empty tables:
Demand Progress Tracking
Activities Progress Tracking
Click ‘Track’. A ‘Process Initiated’ message appears.
Result#
The tables are populated with progress tracking data. To refresh the tracking data, click the ‘Refresh’  button. For more information, see Progress Tracking Tables.
Progress Tracking Tables#
This section goes over the information displayed in each table used for tracking a forecast instance.
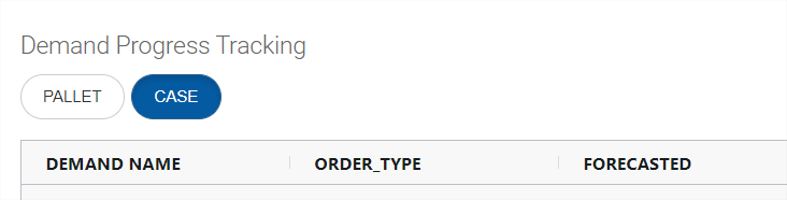
Demand Tracking Table#
The table shows the list of demand records with their quantities grouped by the your Demand Types’ output fields.
The table presents information to help you track the progress of the completed demand quantities. This information includes:
Forecasted demand quantities.
Completed demand quantities—The number of demand quantities completed as of the current moment.
Completed %—The percentage the completed demand quantities represent of the total forecast.
Forecasted %—The percentage the forecasted demand quantities represent as of the current moment. In other words, this column shows how much of your forecast you should have completed.
You can filter the table by units. To do so, click the desired unit button.
Labor Activities Progress Tracking Table#
The Labor Activities Progress Tracking table displays information about each activity to help you track the progress of the labor costs. This information includes:
The forecasted demand quantities associated to each Labor Definition output fields.
The forecasted Measured Hours, Forecasted Goal Hours, and Forecasted Productivity. The table shows these results as a total and by your Labor Definition output fields.
The Actual Measured Hours, Actual Goal Hours, and Actual Productivity. The table shows these results as a total and by your Labor Definition output fields.
The progress metrics calculated in percentage, which are:
Quantity Progress %— The completed demand quantities in percentage, grouped by activity.
Measured Hours Progress %— The actual measured hours in percentage.
Goal Hours Progress %— The actual goal hours in percentage.
You can remove some of these columns by deselecting one or more of the buttons above the table. Here are the columns you can remove, and which button to deselect to remove them.
Columns you can remove |
Button to deselect |
|---|---|
Quantity, Actual Quantity, and Quantity Progress % |

|
Forecasted Measured Hours, Actual Measured Hours, and Measured Hours Progress % |

|
Forecasted Goal Hours, Actual Goal Hours, and Goal Hours Progress % |

|
Other Available Actions#
On the upper right corner of the screen, you can do three actions:
Action |
What To Do |
|---|---|
Go back to the main Forecast Execution screen. |
Click the ‘Back’ |
Refresh the tables’ results |
Click the ‘Refresh’ |
Expand the Demand Progress Tracking and Activities Progress tracking tables. |
Click the ‘Full screen’ |

