Planning Warehouse Maps and Warehouse Maps Widgets#
Use the information in the following topics to start planning your Warehouse Maps widgets:
Learn how Rebus Creates Warehouse Maps Widgets
Learn about the Warehouse Maps Creator’s concepts
Learn about Warehouse Maps Widget concepts
How Rebus Creates Warehouse Maps Widgets#
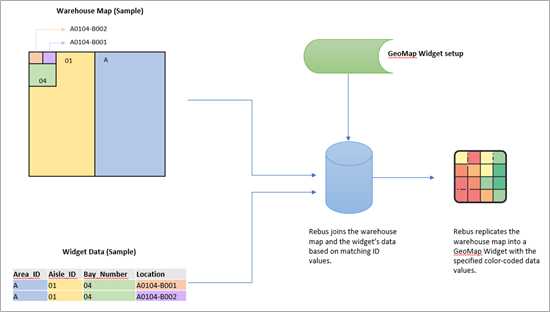
The Warehouse Maps module creates Warehouse Maps widgets in the following manner:
Based on the Warehouse Maps widget’s setup, Rebus determines:
The existing widget in Rebus, and that captures:
The identifier (ID) values of map objects.
Relevant data about map objects that you want to see in the Warehouse Maps.
The warehouse map.
The data that you want to see in the Warehouse Maps.
The data’s color values.
Rebus joins the warehouse map and the widget’s data values based on matching ID values found in the widget and map objects.
Rebus replicates the warehouse map into a Warehouse Maps widget with the specified color-coded data values.
Warehouse Maps Creator Concepts#
The Warehouse Maps Creator is your tool to create a warehouse map. A warehouse map is an interactive two-dimensional map; it’s used as a template to create Warehouse Maps widgets.
Use the information about the following concepts to plan how you will create the warehouse map.
Design vs Import#
Decide how you will create the warehouse map. Two options are available:
Option 1: Manually design the map (with Rebus’s Warehouse Maps Creator). For more information on design methods, see Design Methods.
Option 2: Import a .csv file if your WMS captures your locations’ X, Y, Z coordinates.
Map Object#
A map object is a shape drawn on a layer, and can represent a warehouse space, such as a zone, aisle, bay, location, etc. Map objects are contained inside their respective layer.
Layers#
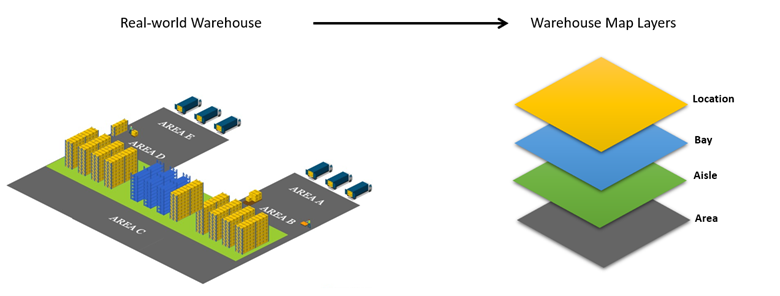
Map layers are used to display color-coded data values in your Warehouse Maps widget; each layer refers to a data source when setting up a Warehouse Maps widget. A layer groups map objects of the same type.
Interactive warehouse maps are made from layers linked to each other. When you add a layer to a warehouse map, you specify its relationship with other layers. For more information about the type of relationship layers can have with one another, see Parent Layers and Map Objects that Move with Parent Layer.
Here’s an example of a real-world warehouse mapped with its layers.
Parent Layers#
Parent layers let you create a hierarchical chain of layers on the map to make it interactive.
Below is an example of a possible layer hierarchical chain:
A zone is a parent to aisles. Clicking a zone displays the aisles that it contains.
An aisle is a parent to racks. Clicking an aisle displays the racks that it contains.

Map Objects that Move with Parent Layer#
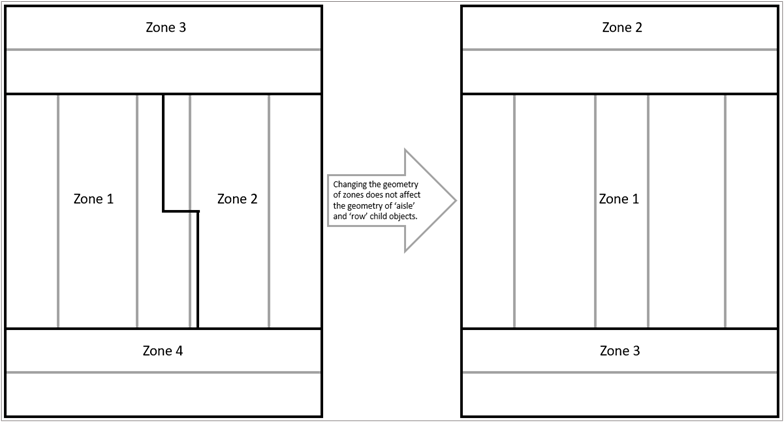
You can set up a layer so that its map objects duplicate any geometric change done to the parent map object that contains these child objects. Geometric changes are stretches, rotations, flips, and moving an object’s position on the map.
The figures below show how map objects behave when child objects move with the object of the parent layer and when they do not.
Figure 1: Behavior of child objects that move with the parent layer.
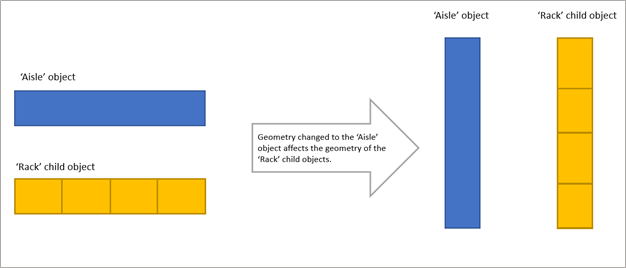
Figure 2: Behavior of child objects that do not move with the parent layer.
Map Object Properties#
Each layer has its own map object properties which are used to identify and assign ID values to the map objects. You create and name these map object properties. For example, BAY_NUMBER is a property in the Warehouse Maps feature which identifies the bays in a warehouse.
You can configure three types of properties for map objects:
Automated property
Simple property
Composite property
Automated Property#
An automated property is used to import the warehouse map and the ID values of the map objects with a .csv file. You can import the warehouse map with a .csv file if your WMS captures the X, Y, Z coordinates of your locations. Configure this property if you plan to import the warehouse map with a .csv file.
See also: ID Values in Map Objects
Simple Property#
A simple property is used to assign a simple ID value to a map object or build a composite property. You configure simple properties if you plan to manually design the map.
Here’s an example of using simple properties to assign ID values to map objects: in the table below, the ID value for an area is always a simple letter.

As a result, for an AREA layer, we could configure a simple property called AREA_ID with a configuration as such:
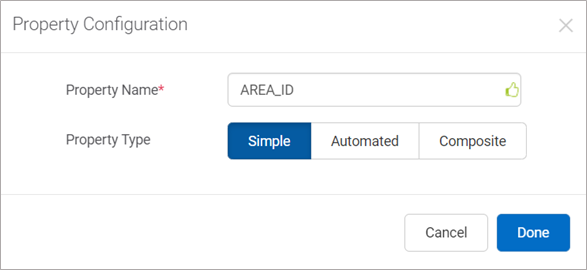
See also: ID Values in Map Objects
Composite Property#
A composite property comprises simple properties. They are useful when you use a naming convention to identify a type of map object. You configure composite properties if you plan to manually design the map.
For example, from the table below, the naming convention of locations (i.e., LOCATION_ID in this example) is to concatenate the AREA_ID, AISLE_ID, BAY_NUMBER, a dash, the location’s LEVEL, and the location’s POSITION.

As a result, for a LOCATION layer, we could configure a composite property called LOCATION_ID built with these simple properties:
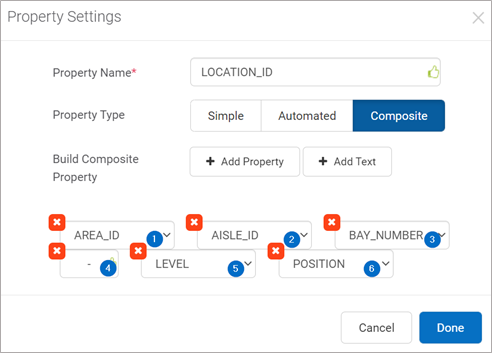
AREA_ID – This simple property would come from the AREA layer.
AISLE_ID – This simple property would come from the AISLE layer.
BAY_NUMBER – This simple property would come from the BAY layer.
A dash.
LEVEL – This simple property would come from the LOCATION layer itself.
POSITION – This simple property would come from the LOCATION layer itself.
Important: To apply a different layer’s simple property in another layer’s composite property, that different layer must be a parent layer somewhere in the hierarchical chain of layers. For more information, see Parent Layers.
See also: ID Values in Map Objects
ID Values in Map Objects#
When designing the warehouse map, you need to populate map objects with ID values matching the ones of the existing widget.
With an automated property, you will be able to import the ID values with a .csv file. With simple and composite properties, you will be able to assign these values in bulk or manually.
You do not need to populate all the layer’s map objects with ID values, but at minimum, you need to populate all map objects of the layer found at the very end of the hierarchical chain. Deciding which layer to populate its objects with values depends on how you plan to set up that layer’s data source. For more information, see Warehouse Maps Widget Concepts.
Design Methods#
You can use three methods to design the warehouse map: top-down, bottom-up, or by importing a .csv file. The next sections describe each method and the cases where they are particularly effective.
Bottom-Up#
This section defines the method and components (i.e., the tool used in this method).
The Method#
When to use:
Some of a layer’s map objects are not the same size. For example, certain unequally sized locations are managed across a bay’s shelves.
There are gaps within a parent map object. For example, an aisle may contain certain bays that are missing the lowest shelve so that employees in vehicles can travel under these bays.
The naming convention of the map objects’ identifiable values does not follow a specific pattern. For example, height bays in a given aisle have the following respective values: A, 2, C, D, 5, 6, F, and 8.
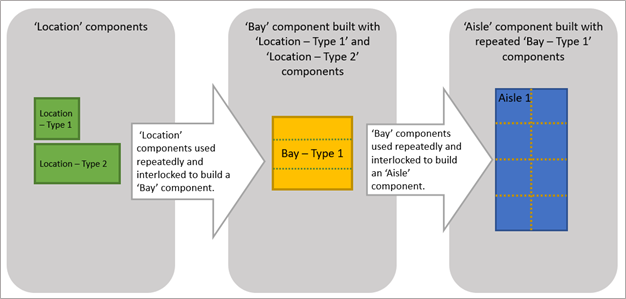
With this method, you first build components of the location’s layer. Then, working your way up the layers, you create the next layer’s components by repeatedly using and interlocking the previously built components (see infographic below).
For more information on what Components are and how to use them in this method, see Components.
Components#
You build and use components to design the warehouse map with the bottom-up method. They are like LEGOs: building blocks that you interlock to make up a whole. In the Warehouse Maps Creator, you must build these components to interlock them. Components can represent locations, bays, aisles, areas, etc.; they belong to their respective layer.
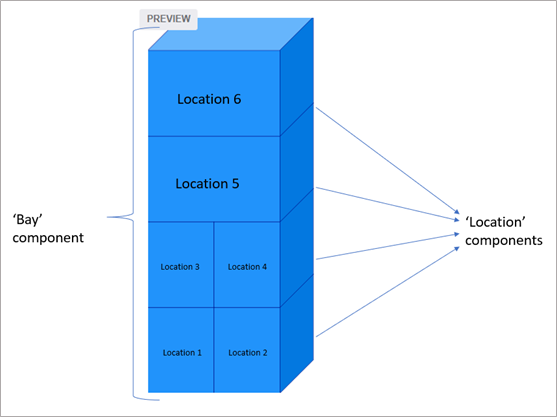
When you have components with different dimensions that you want to use repeatedly, you can build each component only once in Rebus. Consider the below example of a bay with four shelves and six locations, where locations 5 and 6 are larger than locations 1 to 4. To represent this in Rebus, you would create two types of components with different sizes and use them repeatedly to build the “Bay” component.
Top-Down#
This section defines the method and components (i.e., the tool used in this method).
The Method#
When to use:
A layer’s map objects are equally the same size.
There are no gaps within a parent map object. For example, all bays within an aisle have four shelves.
The naming convention of the map objects’ identifiable values follows a specific pattern with no exceptions. For example, in the image below, each bay has a single-digit identifiable value (1, 2, 3, etc.) that increments by one.
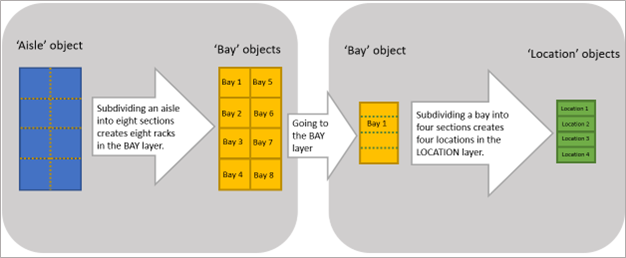
With this method, you first draw the parent object of the highest layer, and you subdivide it to create its child objects. Then, working your way down the layers, you do the same with the objects you’ve created from the previous subdivision (see infographic below).
.csv File Import#
When to use:
You have the XYZ coordinates of your map.
With this method, you create and upload a .csv file with your map’s XYZ coordinates.
Locations Labeling Pattern Form Explained#
Note
 Review this section to better understand how to Assigning Values to Simple Properties in Bulk.
This section goes over key questions and answers for explaining how the Labeling Pattern form works for assigning values to simple properties of location map objects. Use this information to effectively configure the systemic value assignment to your locations.
How Does Assigning Values to Stacked Locations in Bulk Work?#
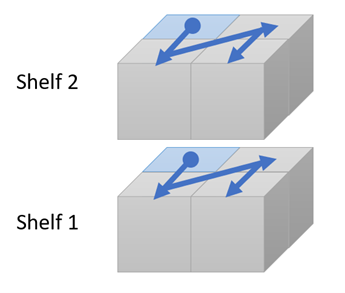
When configuring the labeling pattern for assigning values to location simple properties, the labeling pattern can be thought of as the way inventory products are usually placed on shelves in your warehouse. To illustrate this concept, consider this deconstructed cube that represents locations stacked next to and behind each other on each shelf of a bay. On the cube is an example of a systematic value assignment: the simple property values are assigned in the manner illustrated by the blue arrows, starting at the blue square. The value assignment starts on shelf 1 and then repeats itself on shelf 2 and so on until all shelves are completed.
How do I Indicate Which Side of the Stacked Locations the Value Assignment Should Take Place?#
When assigning values to stacked locations, you need to indicate on which side of the stack the value assignment starts. The arrow combination configuration is used to specify this.

Before understanding how to use the arrow combination configuration and the rest of the Labeling Pattern form, it’s important to understand how Rebus defines a level, row, and a column in stacked locations, and how it positions locations on the map template.
How Rebus Defines a Level, Row, and Column#
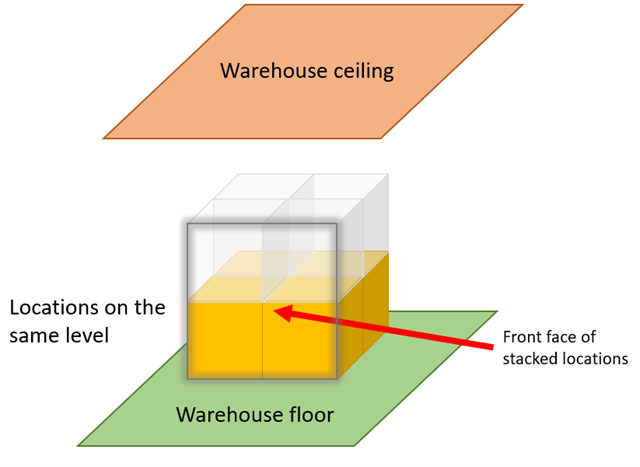
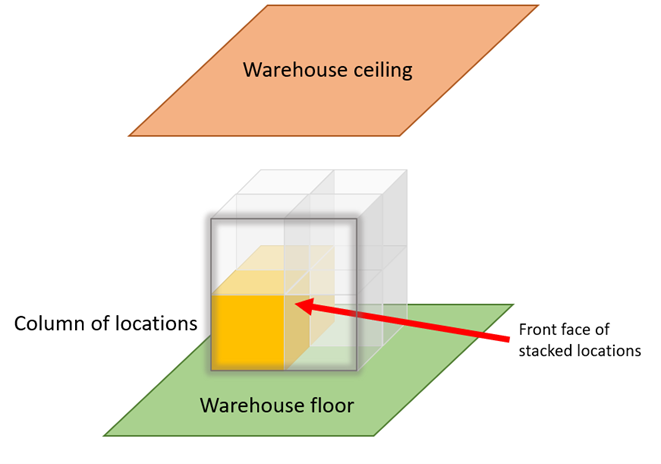
Locations on the same level are arranged side-by-side and form a flat surface within the stacked locations.
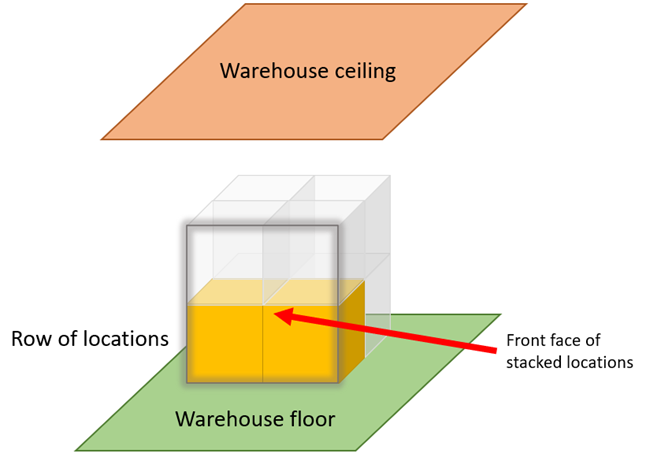
A row is a horizontal sequence of locations.
A column is a vertical sequence of locations.
To illustrate a level, row, and column, consider the following examples where Figure 1 shows in yellow locations on the same level, Figure 2 shows a row of locations, and Figure 3 shows a column of locations.
Locations on the same level#
Row of locations#
Column of locations#
How Rebus Positions Locations on the Map Template#
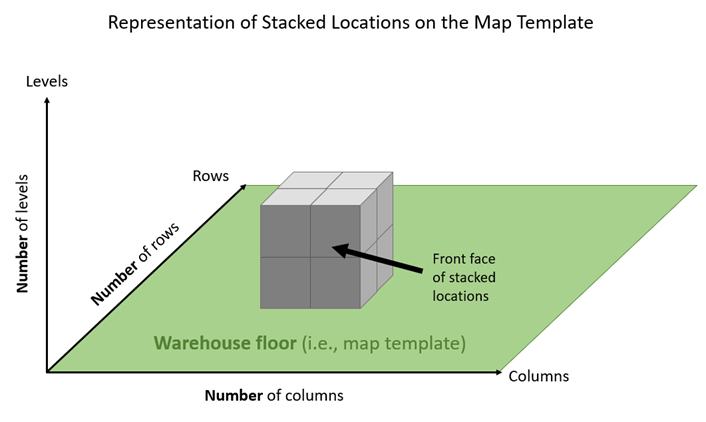
Rebus uses a three-axis Cartesian map labeled with Levels, Rows, and Columns to position locations on the two-dimensional map template. Along the Row axis represents the number of rows; the Column axis represents the number of columns; and the Levels axis represents the number of levels.
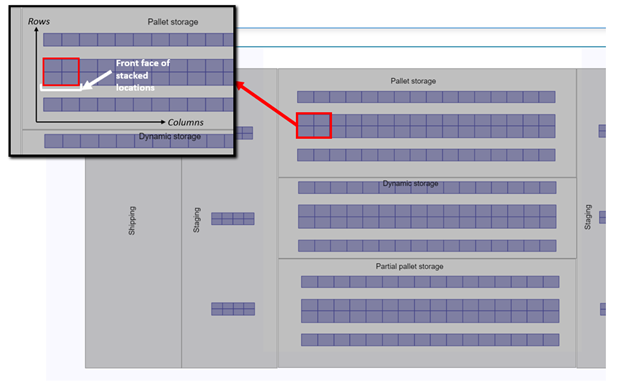
Rebus consistently follows this positioning method, which means that the front face of the stacked locations always faces the Columns axis. The front face never changes sides.
Tip
Before assigning values to locations, overlay the warehouse layout onto the map template to understand its positioning. Doing so lets you determine which face of the stacked locations Rebus designates as the front. In this example, the warehouse layout is horizontally oriented on the map template. By observing the sample stacked locations, you can identify the front face as the one facing the imaginary Columns axis (see zoomed picture). This consistent orientation of the front face applies to all the locations on the map. Rebus always maintains the Rows-Columns axis arrangement shown in the zoomed picture.
Arrow Combinations that Define the Side of the Stacked Locations#
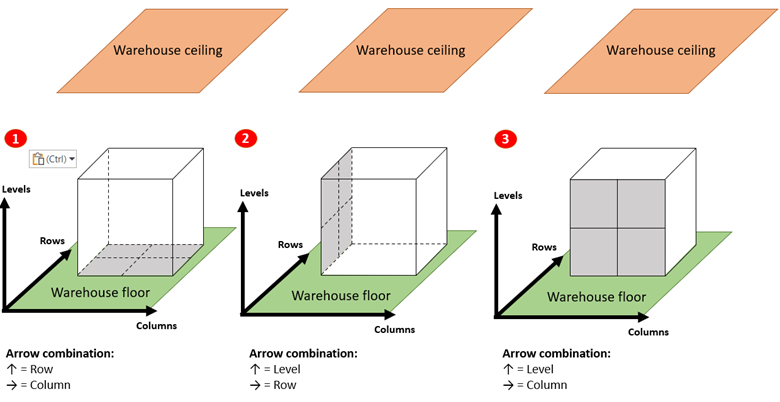
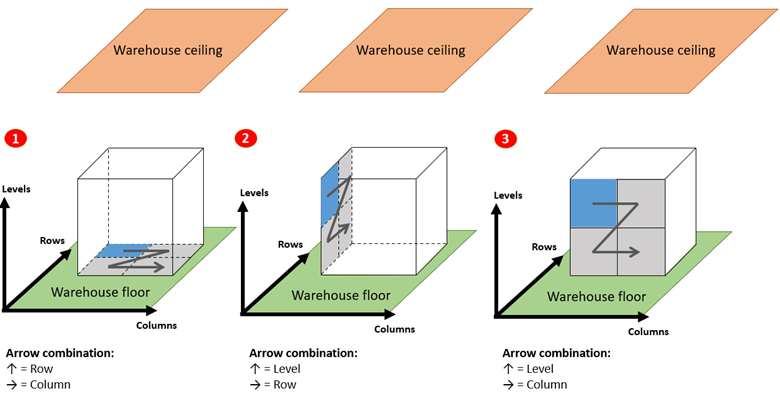
The illustration displays the arrow combinations and their corresponding side of the stacked locations where the value assignment starts, along with the appropriate viewing angle to observe the side of the stacked locations.
Behavior of value assignment according to arrow combinations:
Arrow combination #1:
Whenever the value assignment needs to move vertically, it will move across the rows of stacked locations.
Whenever the value assignment needs to move horizontally, it will move across the columns of stacked locations.
Arrow combination #2
Whenever the value assignment needs to move vertically, it will move across the levels of stacked locations.
Whenever the value assignment needs to move horizontally, it will move across the rows of stacked locations.
Arrow combination #3:
Whenever the value assignment needs to move vertically, it will move across the levels of stacked locations.
Whenever the value assignment needs to move horizontally, it will move across the columns of stacked locations.
How do I Configure the Value Assignment, Including Determining the Starting Point and Direction for Subsequent Value Assignments?#
To configure the value assignment for stacked locations, first choose one of the three arrow combinations to determine the direction for subsequent value assignments. The arrow combinations are:
↑ = Row, → = Column
↑ = Level, → = Row
↑ = Level, → = Column
With these three arrow combinations, the starting point of the value assignment is the blue square on the labeling pattern icon. The direction for subsequent value assignment follows the direction on the labeling pattern.
For example, selecting the Z-Pick 3 pattern results in the following starting points and directions for each of the three arrow combinations:
What if I Want the Value Assignment to Start on One of the Other Three Sides of the Stacked Locations?#
You can adjust the Labeling Pattern’s setting accordingly. For example, let’s say the value assignment starts at the top of the stacked locations…
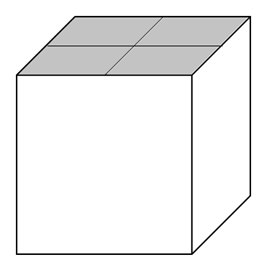
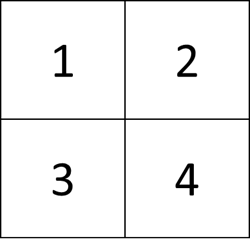
…so that your values are assigned in the order shown in the following figure from a bird’s-eye view:
Level 2 (top level)
Level 1:
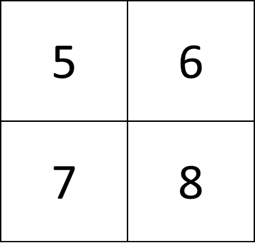
To achieve this labeling, start at the bottom level and assign values counting down from the highest value (i.e., 8).
Here’s how to configure your labeling pattern:
Configure the arrow combination ↑ = Row and → = Column. This starts the labeling at the bottom level.
Select the Z-pick 7 labeling pattern, which is the inverse of Z-Pick 3.
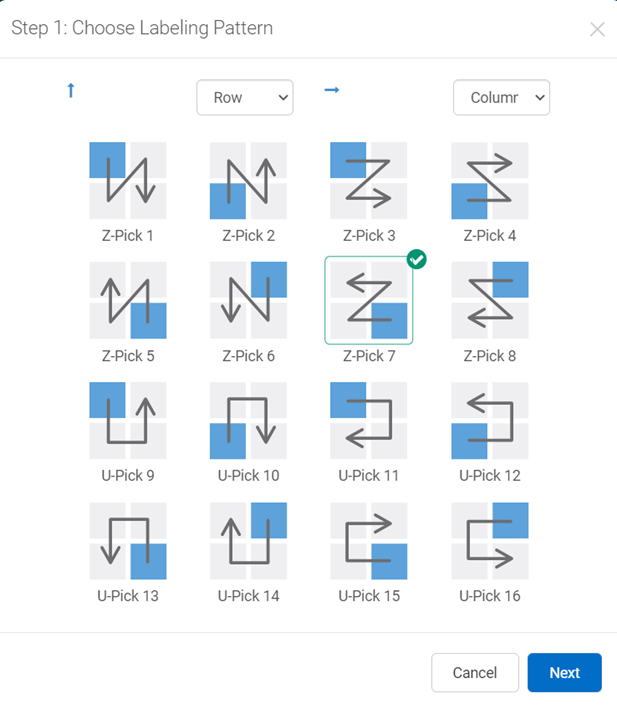
Next to Starting Value, enter the highest value (i.e., 8), and enter a negative decrementing number (i.e., -1).
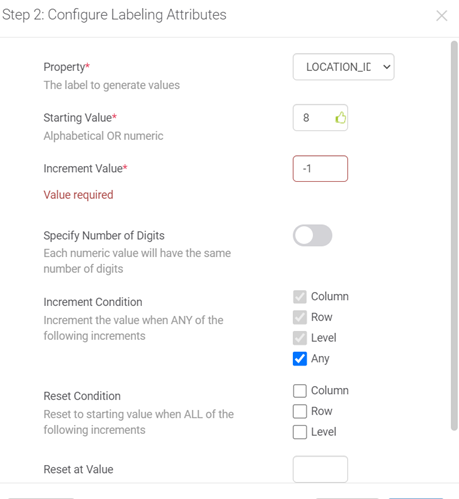
Key takeaway: Set up the Labeling Pattern so that it starts at the bottom and counts backward to assign values to locations until it assigns 1 to a location at the top. This allows you to adjust the value assignment to happen on any of the other three sides of the cube.
What Happens When The Value Assignment Process is Completed on One Side of the Cube?#
After the value assignment is completed on one side of the stacked locations, the process repeats in the remaining third dimension. For example, consider the arrow combination configuration ↑ = Level, → = Column. After assigning values to the front side of the stacked locations (side #1 in purple), Rebus repeats the process on the set of locations at a depth behind the front side (side #2 in orange), following the Cartesian map of levels, rows, and columns used by Rebus. For more information, see How Does Rebus Define a Level, Row, and Column?
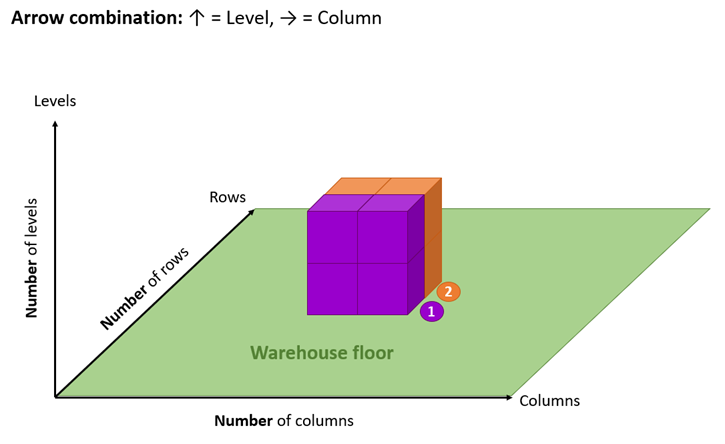
Key Takeaways#
In summary, when assigning values to location map objects, consider the following points:
The front face of the stacked locations is always aligned with the Cartesian map. The front face never changes sides.
Decide which side of the cube to start the value assignment.
Decide where on the cube’s side the value assignment should start.
Decide the direction the value assignment should follow.
Warehouse Maps Widget Concepts#
Use the following concepts to plan how you will set up your Warehouse Maps widget(s).
Data Source#
A data source determines how a layer’s objects are populated with data values. Two options are available:
Widget
Inheritance
Widget Data Source#
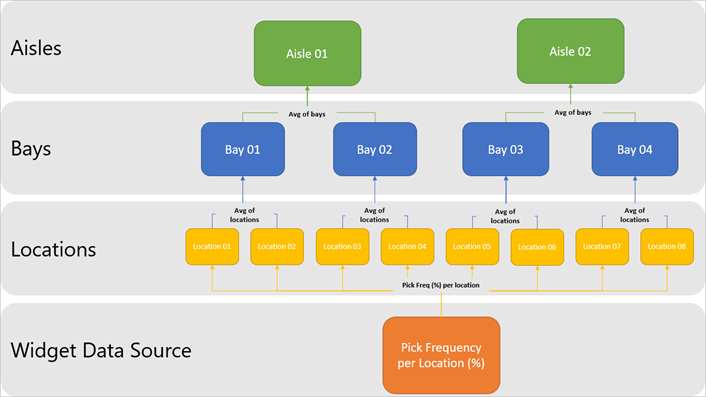
With this data source, the layer’s objects are populated with data values coming directly from an existing widget. For example, the LOCATION layer’s objects are populated with picking frequency values coming directly from the existing widget.
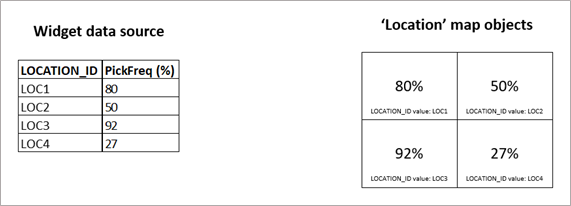
Inheritance Data Source#
With the Inheritance data source, the layer’s objects are populated with aggregated data value coming from their child objects. This aggregated data value can be either the minimum, maximum, average, or sum. As a result, the parent object inherits the coloring of its child objects based on the aggregated value.
A parent object can inherit its child object’s coloring if the child layer at the end of the hierarchical chain is associated with a widget data source. For example, an AISLE object gets the average data from its RACK objects, which in turn get the average data from their LOCATION objects, which in turn get their data from a widget.
Range and Color Mapping#
For a layer with a Widget data source or a layer with the sum-aggregation as its Inheritance Data Source, you must decide:
The data field(s) you want to see in the Warehouse Maps widget, which hold numeric, Boolean, or string values.
A range—whether the data values’ colors are based on absolute values or relative values.
A color mapping—the chosen color for these absolute or relative values.
Absolute Values and their Color Mapping#
With the absolute value color-mapping method, you define the Low, Mid (optional), and High colors and define a value for each of these colors.
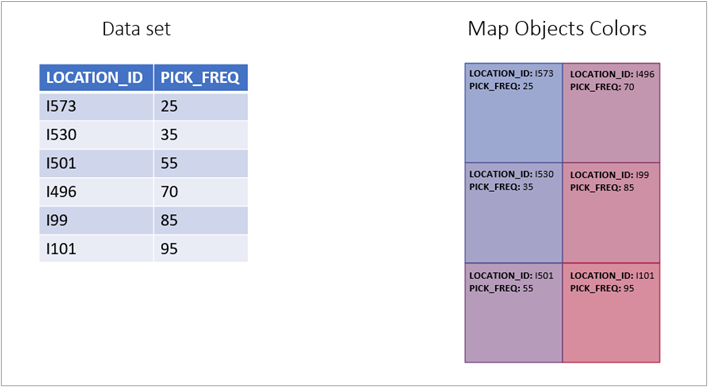
Here’s an example:
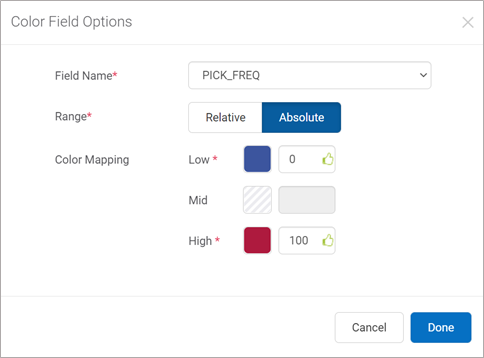
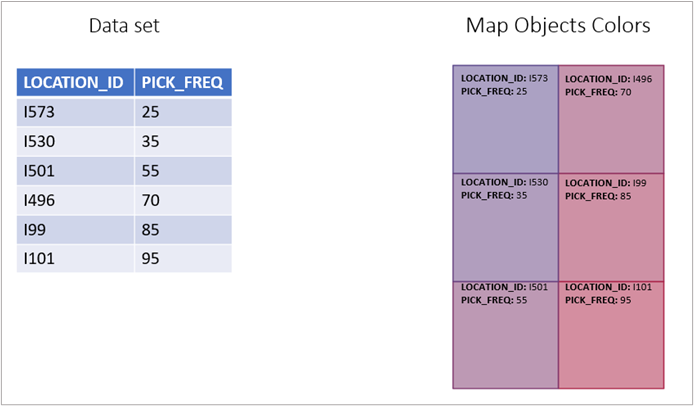
Given the above Color Field Option setup, this dataset below, and the map objects’ PICK_FREQ values, the map objects get their color produced by the two extreme color values.
Relative Values and their Color Mapping#
With the relative value color-mapping method, you first define the Low, Mid (optional), and High colors. Then, Rebus determines the lowest and highest data values in your dataset and associates them with these defined colors.
Here’s an example:
Let’s say we have these Low and High colors set up as a relative color mapping.
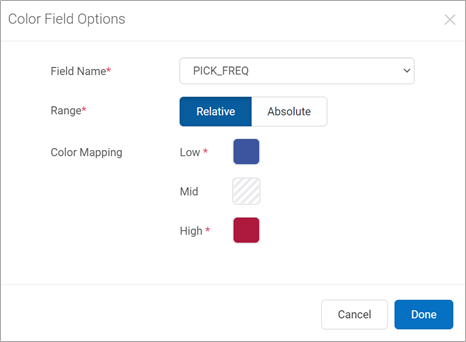
Given the Color Field Option setup above and the dataset below, Rebus associates the lowest and highest PICK_FREQ values (25 and 92) to the Low and High colors. As a result, according to the map objects’ PICK_FREQ values, the map objects get their color produced by the two extreme color values.
Drill Down Paths with Warehouse Maps Widgets#
You can set up a Warehouse Maps widget as the top-level widget of a drill down path.
To create drill down paths with other types of widgets, see Drill Down Paths.
A drill down path with a Warehouse Maps top-level widget works similarly to a regular drill down path, with a few differences:
The path supports only two widget levels: the Warehouse Maps widget and a second widget.
The second widget appears upon double-clicking a map object. For example:
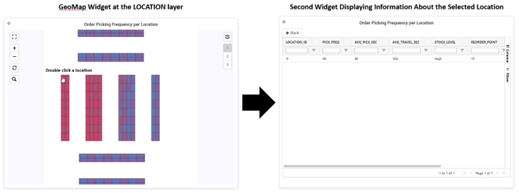
The second widget must have the same filter parameters as the widget data source, plus exactly one additional filter parameter that must be the location identifier field used in the widget data source. For example, if the widget data source has a DATE filter parameter, the second widget should also have this filter parameter along with the LOCATION_ID parameter.
The path is configured on a separate screen and per layer.
The second widget can be any type of chart.