Labor Planning - Evaluating Forecast Accuracy#
This procedure goes over evaluating and comparing forecast accuracy. After you executed a forecast instance, completed demands, and tracked the demand and labor progress, you can evaluate the forecast instance’s accuracy through comparisons. Here’s an overview of these types of comparison:
Type of Comparison |
Why Do This? |
|---|---|
Compare the actual demand and labor results with the forecast results. |
This helps reassess your historical analysis’s accuracy by answering questions like:
You can then create a new Plan Definition setup with the necessary adjustments. |
Compare the accuracy of two or more forecasts. |
This helps determine which forecast was more accurate to use it going forward. |
Creating Forecast Comparisons#
This procedure goes over creating a forecast comparison in which you’ll evaluate and compare one or more forecast instances.
Steps#
To create a forecast comparison, follow these steps:
From the Rebus menu, and select Admin Tools > Labor Planning > Forecast Comparison. You’re at the Forecast Comparison screen.
Click ‘New Comparison’.
Next to ‘Comparison Name’, enter a name for the Forecast Comparison.
Select the forecast instances that you want to compare. Forecast instances are grouped under their respective Forecast Definition.
Click ‘Save’. The Forecast Comparison is created with the ‘New’ status.
Click ‘Compare’.
Note
After completing the steps, you can always add and remove forecast instances, and save the changes.
Result#
Rebus starts processing the accuracy results of each forecast instance; the forecast comparison goes through different statuses. First, it goes into the ‘In process’ status. Then, it gets either of the following statuses:
Completed: the forecast accuracy results are generated, and two tables are populated with data: Demand Accuracy, and Activities Accuracy. For more information, see Accuracy Tables.
Error: this indicates that some forecast instances failed to execute. Next to ‘Errors’, you can identify which instances were affected.
Accuracy Tables#
This section goes over what each table displays in the Forecast Comparison screen.
Demand Accuracy Table#
The table groups the accuracy results by forecast instance, Demand Type, and your Demand Type output fields. You identify forecast instances by their executed date. In the example below, results are grouped by the forecast instance FORECAST 01, Demand Type OUTBOUND ORDERS, and output field ORDER_TYPE.
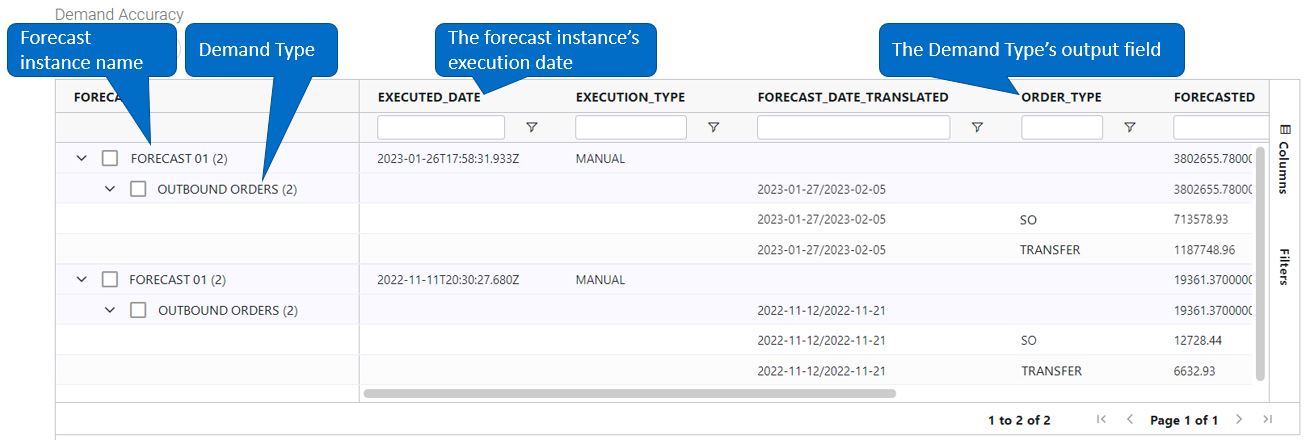
The table presents important information to help you analyze the accuracy of the forecasted demand quantities. This information includes:
Forecasted Quantity
Actual Quantity
Accuracy %—The accuracy percentages of demand quantities.
Forecast_Date_Translated—The start and end date of the forecast’s date range.
Forecast_Date_Range
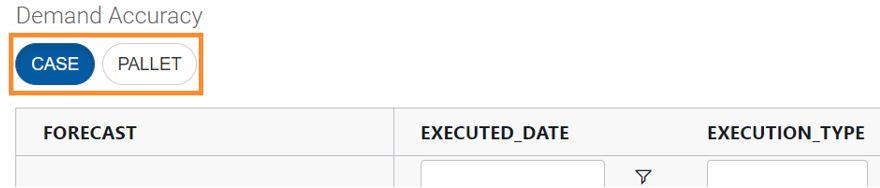
To filter the table by units, click the desired unit button.
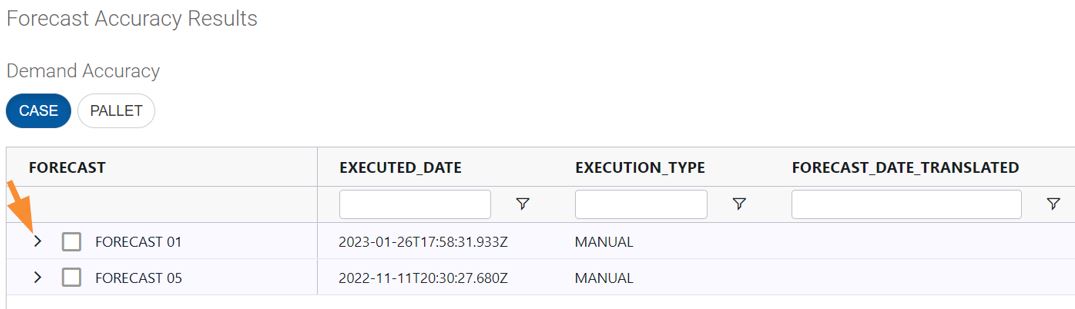
For each forecast instance, the table presents aggregated results under different columns. To see the results for each demand, click the chevron under the Forecast column:
Activities Accuracy Table#
For each forecast, the Activities Accuracy table displays information to help you analyze the accuracy of the forecasted activity costs. This information includes:
The Forecasted Demand Quantity grouped by your Labor Definition output fields.
The Actual Demand Quantity that’s been completed by your Labor Definition output fields.
The Forecasted Measured Hours, Forecasted Goal Hours, and Forecasted Productivity—These results are shown as a total and grouped by your Labor Definition output fields.
The Actual Measured Hours, Actual Goal Hours, and Actual Productivity—These results are shown as a total and grouped by your Labor Definition output fields.
The accuracy metrics calculated in percentage, which are:
Quantity Accuracy %— The accuracy percentage of demand quantities grouped by activity and any other output field in the Labor Definition.
Measured Hours Accuracy %— The accuracy percentage of measured hours.
Goal Hours Accuracy %— The accuracy percentage of goal hours.
To filter the labor accuracy results for a specific forecast instance, select the checkbox next to the desired forecast instance under the Forecast column in the Demand Accuracy table. The results in the Labor Accuracy table will then be filtered accordingly.
You can remove some of these columns by deselecting of one or more of the buttons above the table. Here are the columns you can remove, and which button to deselect to remove them.
Columns you can remove |
Button to deselect |
|---|---|
Quantity, Actual Quantity, and Quantity Accuracy % |

|
Forecasted Measured Hours, Actual Measured Hours, and Measured Hours Accuracy % |

|
Forecasted Goal Hours, Actual Goal Hours, and Goal Hours Accuracy% |

|
Forecast Productivity and Actual Productivity |

|