Creating Widgets Based on Labor Planning Results#
You can create widgets using the results generated by the Labor Planning Module. Here are the key points to keep in mind:
Select the right data source depending on the type of results you want to use:
LP FORECAST RESULTS for forecast results.
LP DEMAND PROGRESS TRACKING for demand progress tracking results.
LP LABOR PROGRESS TRACKING for labor activities progress tracking results.
LP DEMAND ACCURACY for demand accuracy results.
LP LABOR ACCURACY for labor activities accuracy results.
You must convert certain object arrays to column data. For more information, see Converting Object Arrays into Separate Data Columns.
The Labor Planning Module initially presents the forecast, progress tracking, and accuracy results in a specific format.
Converting Object Arrays into Separate Data Columns#
Note
 This procedure assumes that you have a good understanding of JavaScript Object Notation (JSON), JSON objects and arrays. While it’s possible to follow the procedure without prior knowledge of JSON, doing so may result in an incomplete understanding of why certain steps are necessary. If you’re unfamiliar with JSON, a good resource that you can start with is https://www.w3schools.com/js/js_json_intro.asp.
To create widgets based on Labor Planning results, you need to extract specific data from certain data fields’ object arrays and convert them into separate columns with appropriate names. For example, the DEMAND_OUTPUT_FIELDS object arrays are transformed into separate columns for the demand type’s output field values: WAREHOUSE_CODE and ORDER_TYPE values.
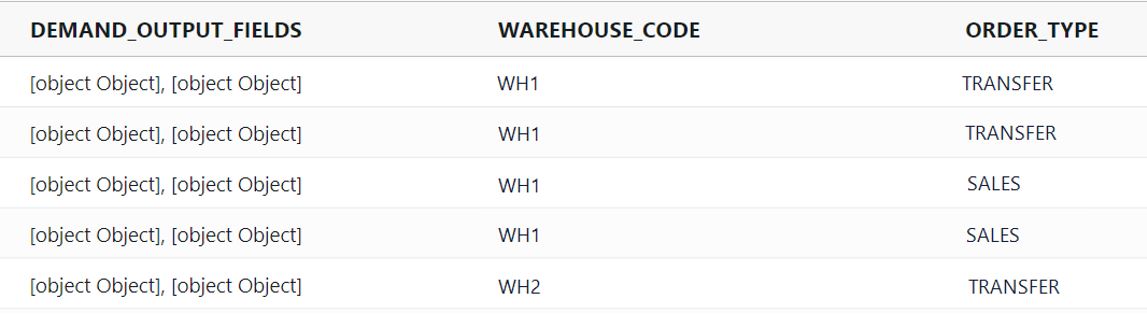
The information contained in DEMAND_OUTPUT_FIELDS can be illustrated in the example below. Each object is a combination of key-value pairs, where each key represents an attribute of the object, and each value represents the value of that attribute. The goal of this tutorial is to extract only the fields FIELD_NAME and FIELD_VALUE to create separate columns with their own specific names as shown in the illustration above.
{
   "DEMAND_OUTPUT_FIELDS" : [

          {
                  "FIELD_NAME" : "ORDER_TYPE",
                      "FIELD_VALUE": "TRANSFER",
                      "FIELD_TYPE": "string",
                      "_class" : "com.rebusap.labor.planning.planningservice.model.mongo.ForecastField"

              },
              {
             "FIELD_NAME" : "WAREHOUSE_CODE",
              "FIELD_VALUE": "WH1",
              "FIELD_TYPE": "string",
              "_class" : "com.rebusap.labor.planning.planningservice.model.mongo.ForecastField"
          }

       ],

 }
You do this to the following data fields of the Labor Planning data sources:
DEMAND_OUTPUT_FIELDS
LABOR_OUTPUT_FIELDS
QUANTITY_FIELDS (i.e., fields holding the demand quantities)
Note
In this tutorial, we will use the Widget Builder’s non-guided mode to break down the procedure of building a complex expression into comprehensive steps.
Step 1: Create Calculated Fields with the Map() function#
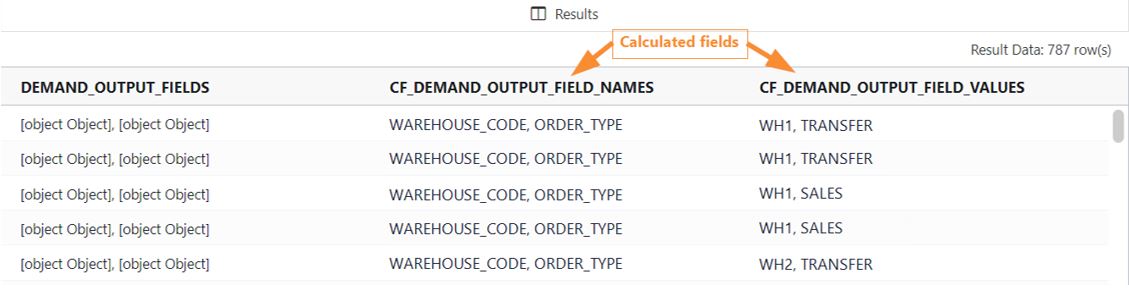
This step goes over creating a calculated field using the map() function to convert an array of objects within a field into an array of values. We will use the example of converting the DEMAND_OUTPUT_FIELDS array of objects into two separate arrays representing the demand type’s output field names and output field values (see the illustration below for an overview of the example input and the result).
Example Input:
Example output:
Follow these steps:
After you’ve filled out the Basic Information and the Filters stage, add a Display Fields stage.
Create calculated fields using the map() function to convert the arrays of objects into arrays of field names, and values. Refer below to the expressions to use, and the explanation of the map() function:
Expressions: The table describes the expressions to use, and an example for each expression with a calculated field name.
Expression that…
Example Expression
Example Calculated Field Name
Returns the array of field names.
map(DEMAND_OUTPUT_FIELDS, "elem","$$elem.FIELD_NAME")
CF_DEMAND_OUTPUT_FIELD_NAMES
Returns the array of field values.
map(DEMAND_OUTPUT_FIELDS, "elem", "$$elem.FIELD_VALUE")
CF_DEMAND_OUTPUT_FIELD_VALUES
Map() function explained: The map() function has three components which are explained using the current example.
DEMAND_OUTPUT_FIELDS is the input array, i.e., the field containing the information about the demand output field names and their values.
elemis the name given for the variable that represents each individual element in the input array (i.e., DEMAND_OUTPUT_FIELDS in this example).$$elem.FIELD_NAMEand$$elem.FIELD_VALUESare the data fields for the map() function to extract their values and return them as arrays. In this example, we’re returning ‘ORDER_TYPE, WAREHOUSE_CODE’ as the array of values for FIELD_NAME, and all available arrays for FIELD_VALUE (e.g., ‘WH1, TRANSFER’, ‘WH1, SALES’, ‘WH2, TRANSFER’, etc.).
Repeat step 2 to create the remaining calculated fields for the Labor Definition output fields, and the quantity fields:
To do this for Labor Definition output fields, replace DEMAND_OUTPUT_FIELDS by LABOR_OUTPUT_FIELDS in the expressions.
To do this for quantity fields, replace DEMAND_OUTPUT_FIELDS by QUANTITY_FIELDS in the expressions.
To save the calculated field, click ‘Save’.
Click ‘Next’.
Go to Step 2: Create Calculated Fields to Display Data into Separate Columns.
Step 2: Create Calculated Fields to Display Data into Separate Columns#
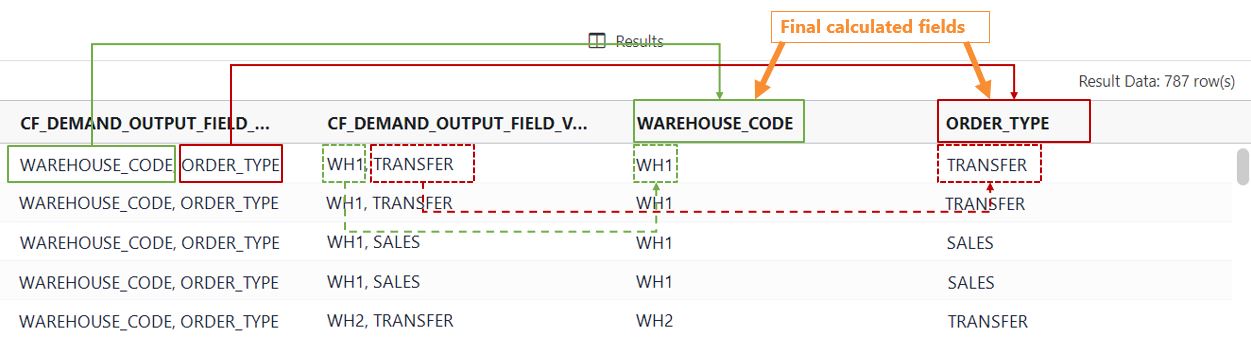
In this step, we will add a second Display Fields stage to create the final calculated fields that display the data in separate columns. Using the example from step 1, we will extract the values from the previously calculated fields to create the final calculated fields WAREHOUSE_CODE and ORDER_TYPE, which will display their respective values in their own columns:
Follow these steps:
Add a second Display Fields stage.
Create the calculated field by using the example expressions below. Replace the calculated fields by the ones you’ve created at step 1, and the string values WAREHOUSE_CODE and CASE by yours.
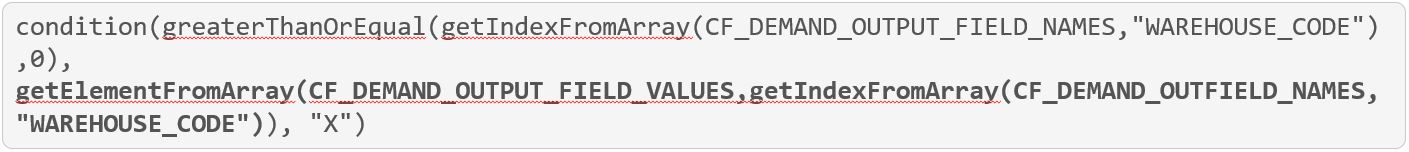
Expression that returns output field values:
condition(greaterThanOrEqual(getIndexFromArray(CF_DEMAND_OUTPUT_FIELD_NAMES,"WAREHOUSE_CODE"),0), getElementFromArray(CF_DEMAND_OUTPUT_FIELD_VALUES,getIndexFromArray(CF_DEMAND_OUTFIELD_NAMES,"WAREHOUSE_CODE")), "X")
Expression that returns quantity field values:
toDouble(condition(greaterThanOrEqual(getIndexFromArray(CF_QUANTITY_FIELD_NAMES,"CASE"),0), getElementFromArray(CF_QUANTITY_FIELD_VALUES,getIndexFromArray(CF_QUANTITY_FIELD_NAMES,"CASE")),"0"))
Expression explained: The most important part of the expression is in bold. The rest of the expression is simply to account for possible error scenarios.
Let’s break down the bold expression to explain what it does:
The
getElementFromArray()function gets a specific element from an array. In this example, the element we want to retrieve is the WAREHOUSE_CODE’s value (e.g., WH1, WH2, etc.) from the array called CF_DEMAND_OUTPUT_FIELD_VALUES.The
getIndexFromArray()function finds the index of a specific element within an array. In this example, we want to find the index of WAREHOUSE_CODE’s value (e.g., WH1, WH2, etc.). To do this, we’re finding the index of the value ‘WAREHOUSE_CODE’ within the array called CF_DEMAND_OUTPUT_FIELD_NAMES. This is because the index of ‘WAREHOUSE_CODE’ in CF_DEMAND_OUTPUT_FIELD_NAMES is the same as the index of the WAREHOUSE_CODE’s value in the array called CF_DEMAND_OUTPUT_FIELD_VALUES.
To save the calculated field, click ‘Save’.
Add the other stages that you need to finish building your widget.