Working with Warehouse Map Widgets on Dashboard#
After you’ve added the widget to a dashboard, you can perform the following actions on the displayed Warehouse Maps widget:
Viewing the Warehouse Maps Widget in Full Screen#
Click the ‘View Full Screen’ button.
To exit the full screen, click the ‘Exit Full Screen’ button.
Working with Layers on the Warehouse Maps Widget#
Layers let you organize and visualize your data in various ways. This section covers several actions you can perform with layers in the Warehouse Maps widget, including:
Displaying Layers on the Warehouse Maps Widget
Viewing Location Levels
Overlaying layers with other layers
Rearranging Layer Superpositions
Displaying Layers on the Warehouse Maps Widget#
Hover over the layers icon.
Select the desired layer(s). The Warehouse Maps widget displays the layer(s) and their map objects. Selecting more than one layer creates an overlay effect. For more information on overlaid layers, see Overlaying Layers with Other Layers.
Viewing Location Levels#
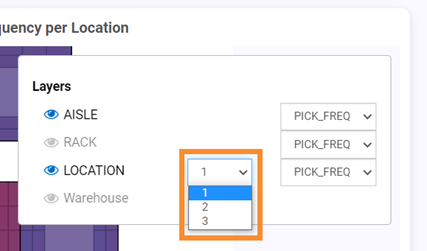
If you’ve navigated to the layer that consists of locations, you can view a specific level of that layer. To do so, follow these steps:
Hover over the layers icon.
Next to the right layer, select the desired level number.
Overlaying Layers with Other Layers#
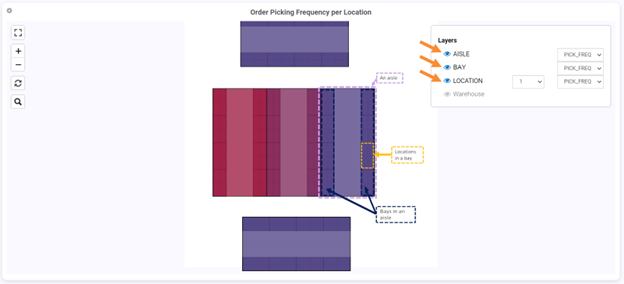
You can overlay layers with other layers to see where and how child objects are positioned within their parent objects. You can also overlay the Warehouse Maps widget with the warehouse’s layout, which comprises elements like doors, supporting poles, rooms (e.g., break room, office), areas (e.g., staging, packaging, loading, unloading, etc.). By overlaying the map with the warehouse’s layout, you can see where map objects are in relation to these elements.
In this example, the Warehouse Maps widget is overlaid with the LOCATION, the BAY, and the AISLE layers. As a result, we can see the locations in each bay, and the bays in the aisles.
Follow these steps:
Hover over the layers icon.
Select the desired layer(s). To overlay the map with the warehouse’s layout, select ‘Warehouse’.
Rearranging Layer Superpositions#
You can adjust the order of the map layers to determine how they are overlaid. This is useful when you have several layers that can overlap, and you want to decide which layer is superimposed on top of another.
Follow these steps:
Hover over the layers icon.
Drag the layers to the desired position of the list. The layers are listed in vertical order, with the map’s topmost layer appearing on top of the list, and subsequent layers appearing below it in the order in which they are listed. Therefore, when a new layer is dragged to the top of the list, it becomes the topmost layer, and all other layers are positioned below it.
Working with Warehouse Maps Widget Data#
A Warehouse Maps widget lets you visualize and interact with data on the map. The following actions are available for working with the data associated with individual map objects in the widget:
Displaying Data Color Values on the Warehouse Maps Widget
Viewing a Map Object’s Data Values
Displaying Details of a Map Object’s Data Values
Displaying Data Color Values on the Warehouse Maps Widget#
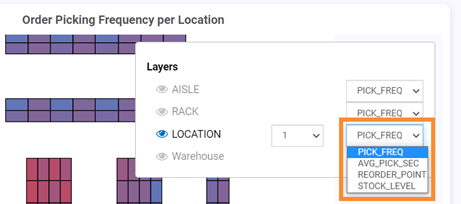
To view the coloring applied to the data field values, follow these steps:
Hover over the layers icon.
Next to the desired layer, select the data field name to display its color values on the Warehouse Maps widget.
Viewing a Map Object’s Data Values#
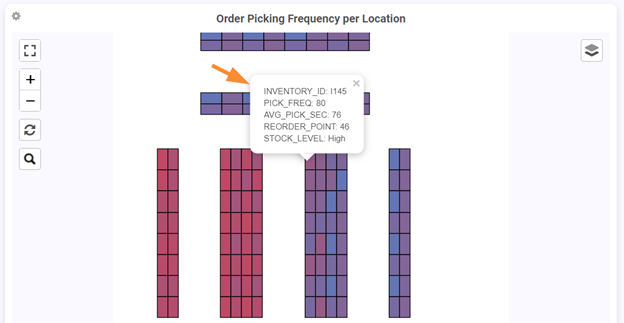
Click the desired map object of the Warehouse Maps widget. The map object’s relevant information appears, such as its unique ID value and field values.
Displaying Details of a Map Object’s Data Values#
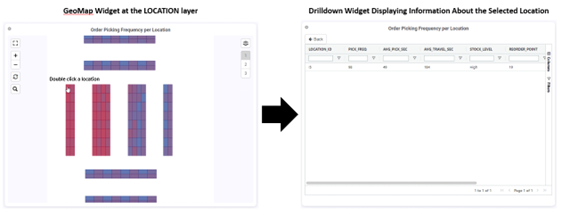
You can view additional details about a map object’s data values by opening a drilldown widget through a simple double-click action. For example, if you double-click a location on the map, a drilldown widget appears, providing you with more information on the selected object.
Note
 You can do this if the layer is set up with a drilldown widget. For more information on how to add a drilldown widget to a layer, see Step 1: Adding a Warehouse Maps Widget.
Searching Map Objects on Map#
To search map objects on the map by their property values, follow these steps:
Ensure the corresponding layer is selected: hover over the layers
 icon and verify that the layer’s eyeball icon
  is blue. If not, select the layer.
Enter the map object’s property value. A list dynamically updates with matching results.
Select one of the results or press the ‘Enter’ key. The map highlights the matching map object with a red circle.
Zooming in and Out of the Map#
To zoom in the map, click the ‘+’ button.
To zoom out the map, click the ‘-’ button.

