Widget Reference#
This section covers Rebus’s default out-of-the-box widgets. You are also able to create your own widgets.
Cycle Time#
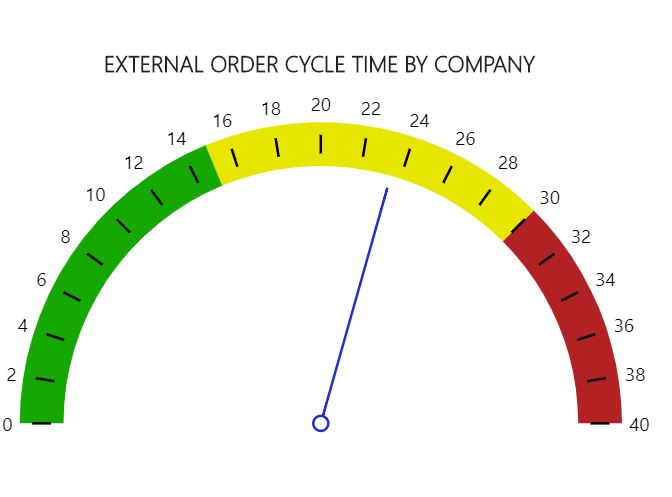
External Order Cycle Time by Company#
Shows the average external order cycle time across the enterprise over the date range.
Drill down notes: Click on gauge to get to External Order Cycle Time by Warehouse.
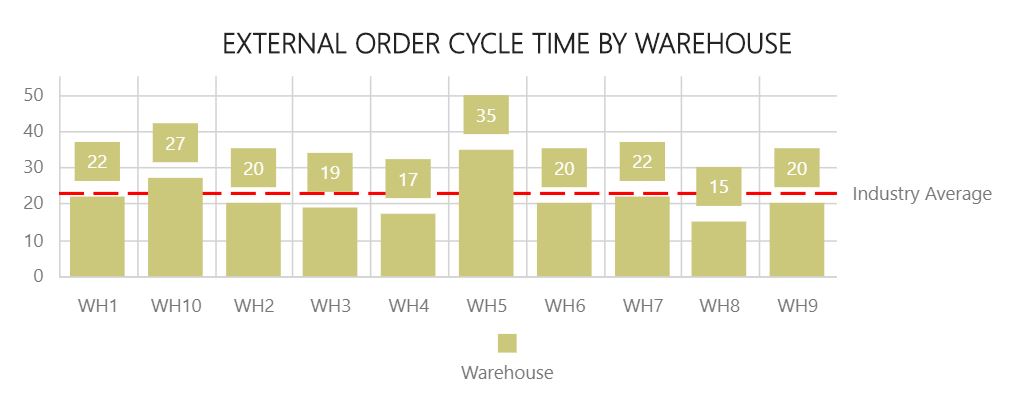
External Order Cycle Time by Warehouse#
Lets you compare the average external order cycle time of all warehouses over the date range.
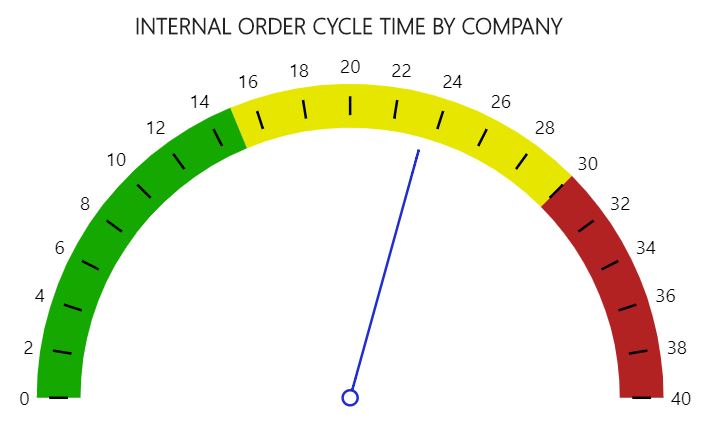
Internal Order Cycle Time by Company#
Shows the average internal order cycle time across the enterprise over the date range.
Drill down notes: Click on gauge to get to Internal Order Cycle Time by Warehouse.
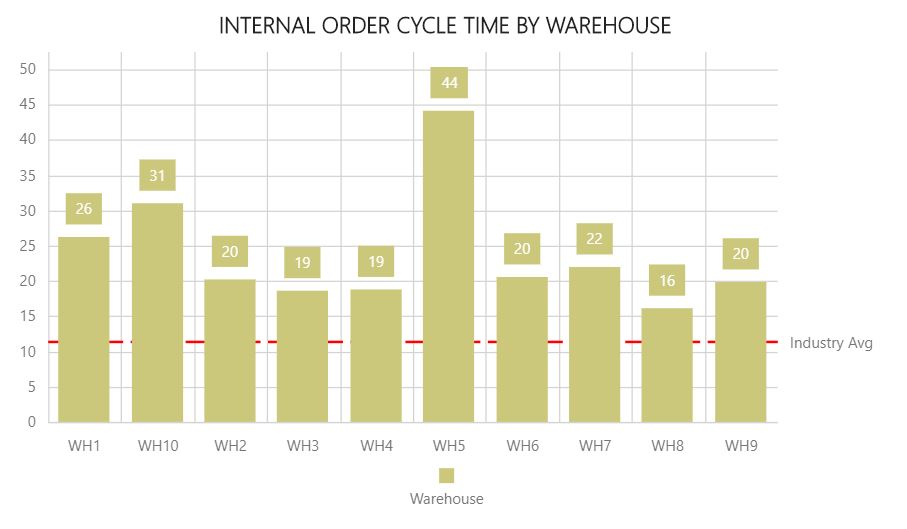
Internal Order Cycle Time by Warehouse#
Lets you compare the average internal order cycle time of all warehouses over the date range.
Inbound Performance#
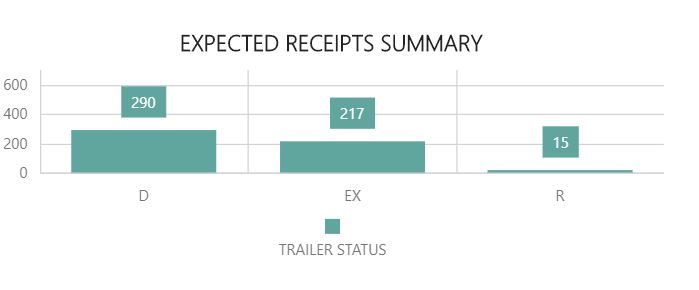
Expected Receipts Summary#
Shows you the number of trailers that are expected to be received broken down by trailer status.
Receive Truck Status Summary#
Shows the high-level details of each trailer of a specified status destined for a specified warehouse.

Receive Truck Detail#
Shows the details of each item on each trailer of a specified status destined for a specified warehouse.

Inventory - Adjustments#
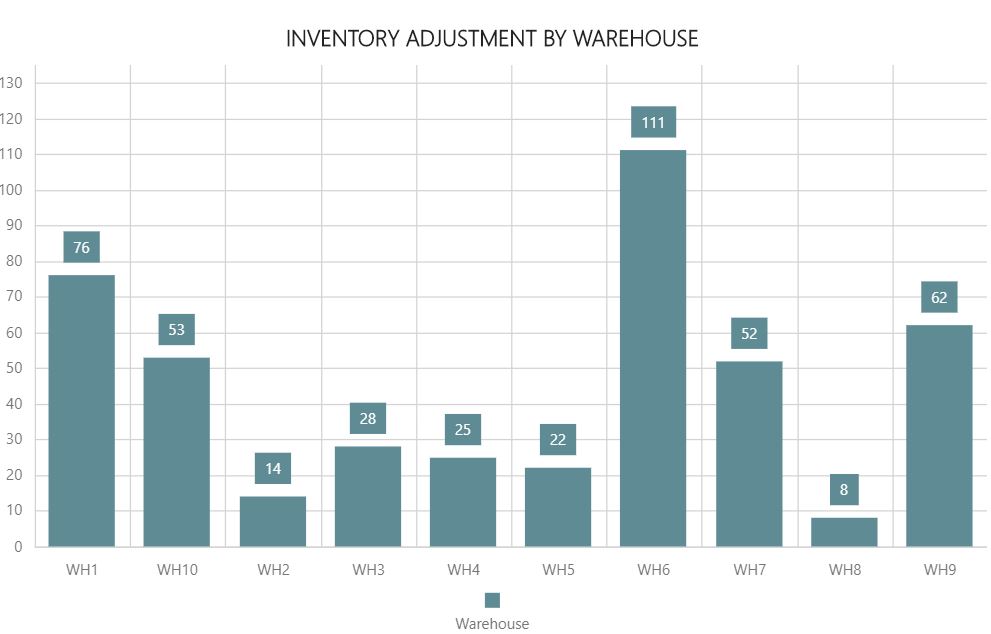
Inventory Adjustments by Warehouse#
Shows the number of inventory adjustments at a warehouse over a specified time period.
Drill down notes: Click on bar to get to Inventory Adjustment Details.
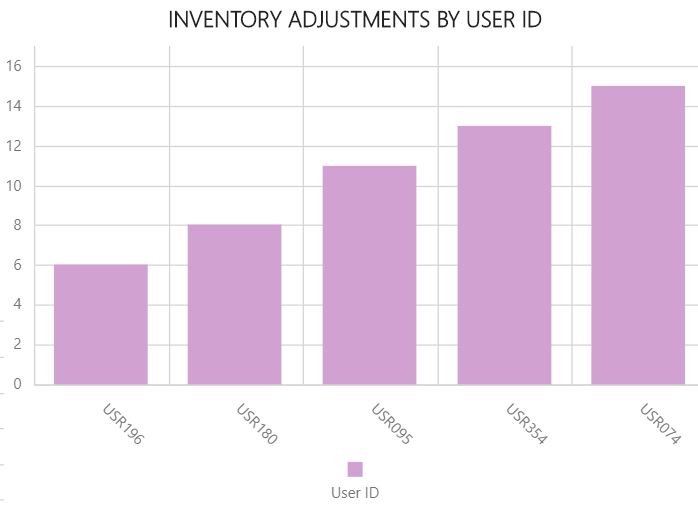
Inventory Adjustments by User ID#
Shows the number of inventory adjustments that a user ID made over a specified time period.
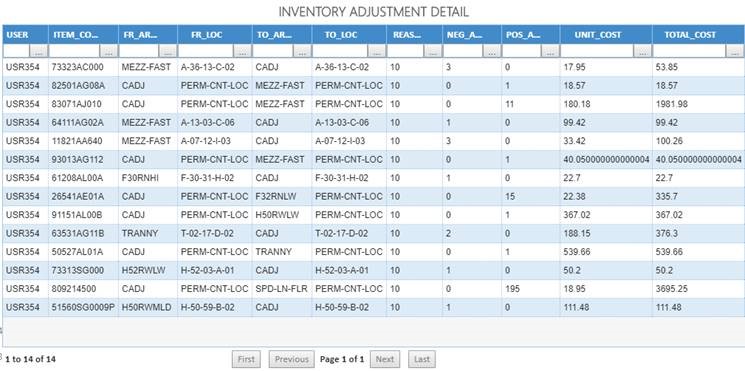
Inventory Adjustment Details#
Shows the details of all inventory adjustments done across the enterprise during the specified date range.
Inventory - Capacity#
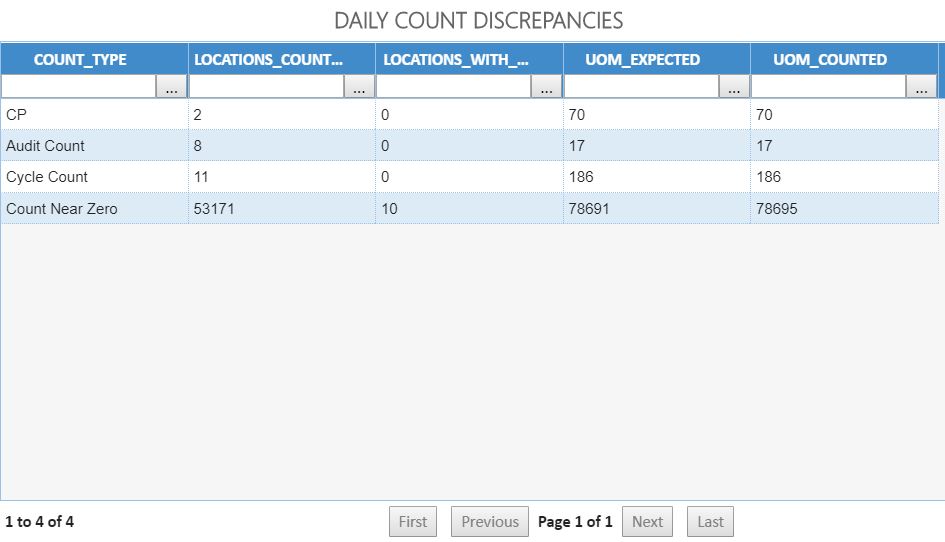
Daily Count Discrepancies#
Shows grid totals for locations counted, locations with discrepancies, UOM expected, and UOM counted.
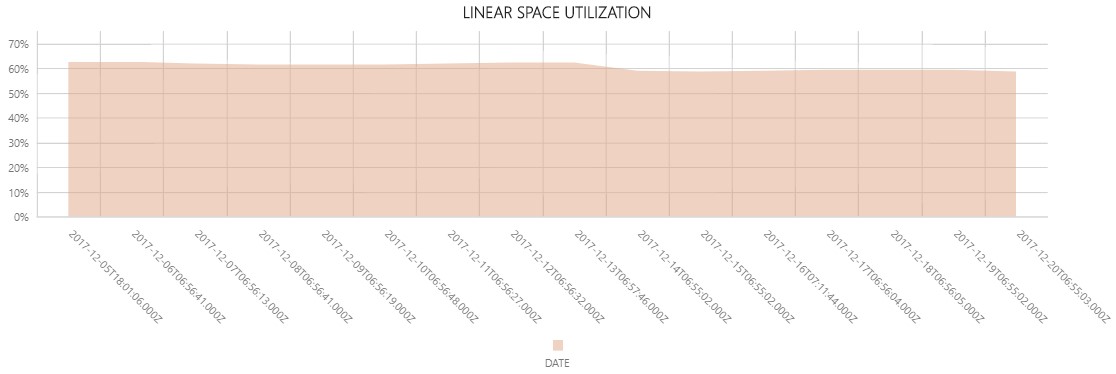
Linear Space Utilization#
Shows daily trending for warehouse space utilization.
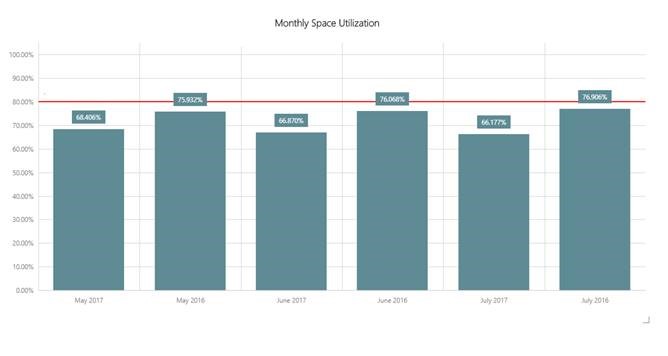
Monthly Space Utilization#
Shows a warehouse’s space utilization from month to month.
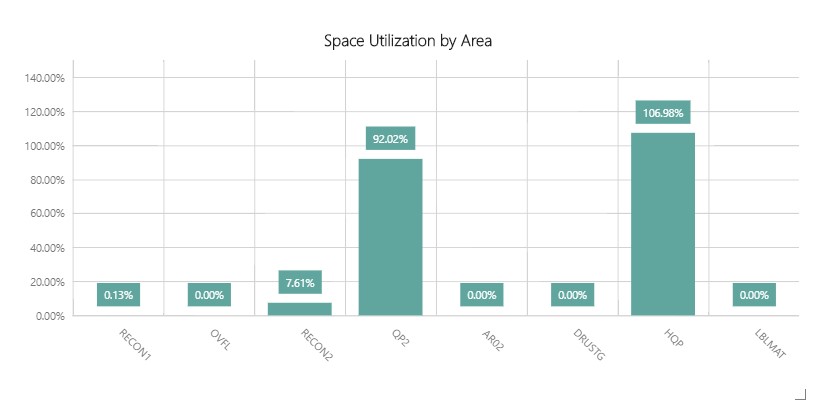
Space Utilization by Area#
For each warehouse area, shows you the current breakdown of how much of it is full, empty, or partially filled.
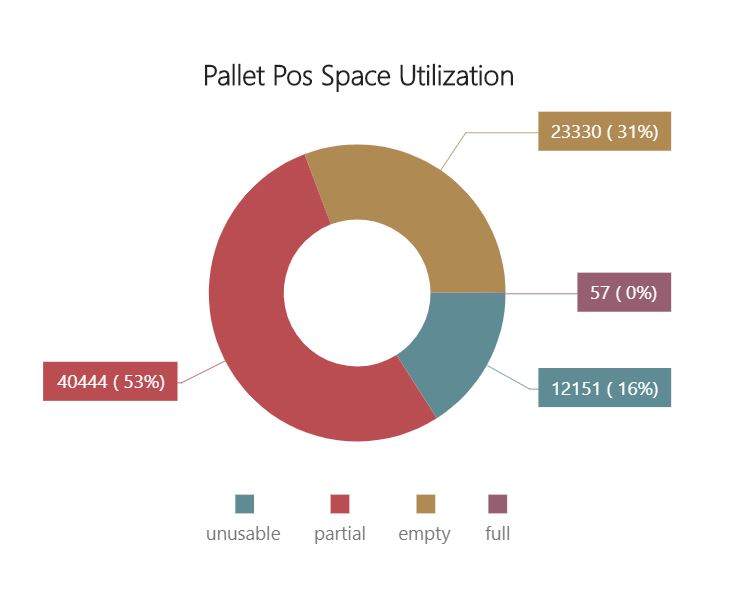
Pallet Position Space Utilization#
A pie chart that lets you compare how many locations in the warehouse are full, empty, partially filled, or unusable. To see the number of locations at a particular status, hover your mouse over the pie slice.
Inventory - Counting#
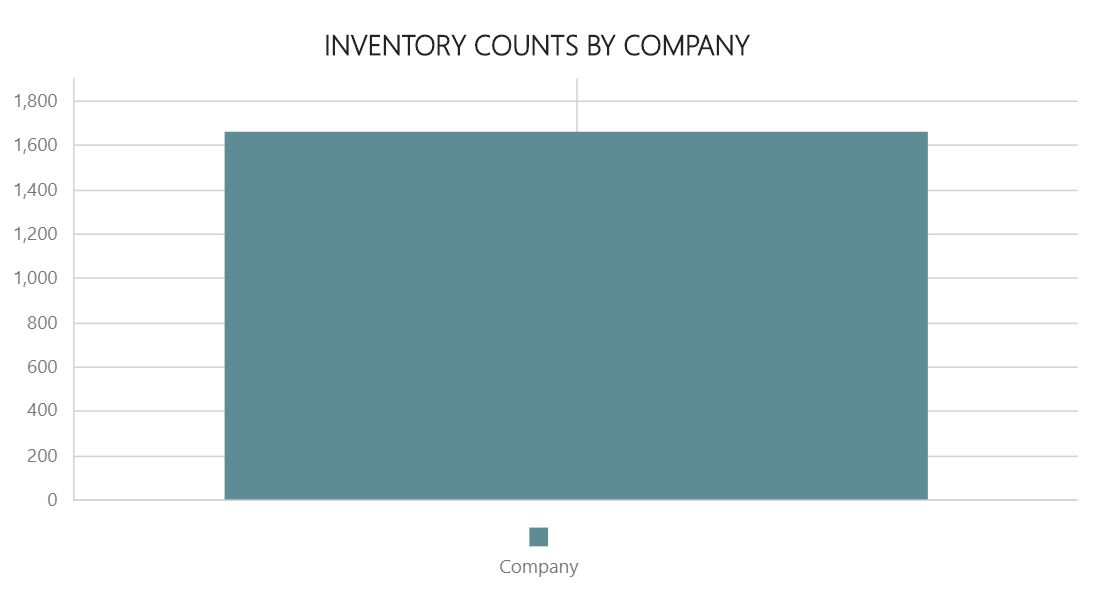
Inventory Counts by Company#
Shows number of cycle count transactions done across the enterprise over the date range.
Drill down notes: Click on bar to get to Inventory Counts by Warehouse.
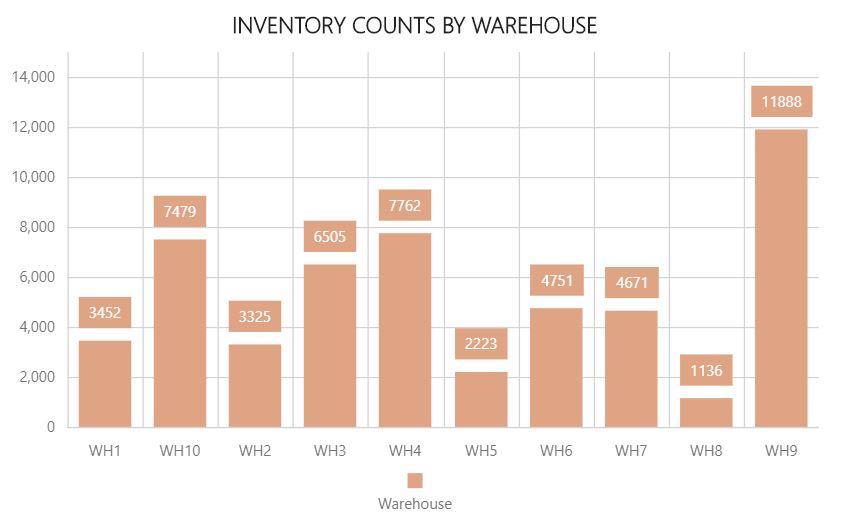
Inventory Counts by Warehouse#
Lets you compare the number of count transactions done at each warehouse over the date range.
Drill down notes: Click on bar to get to Inventory Counts Accuracy Summary.
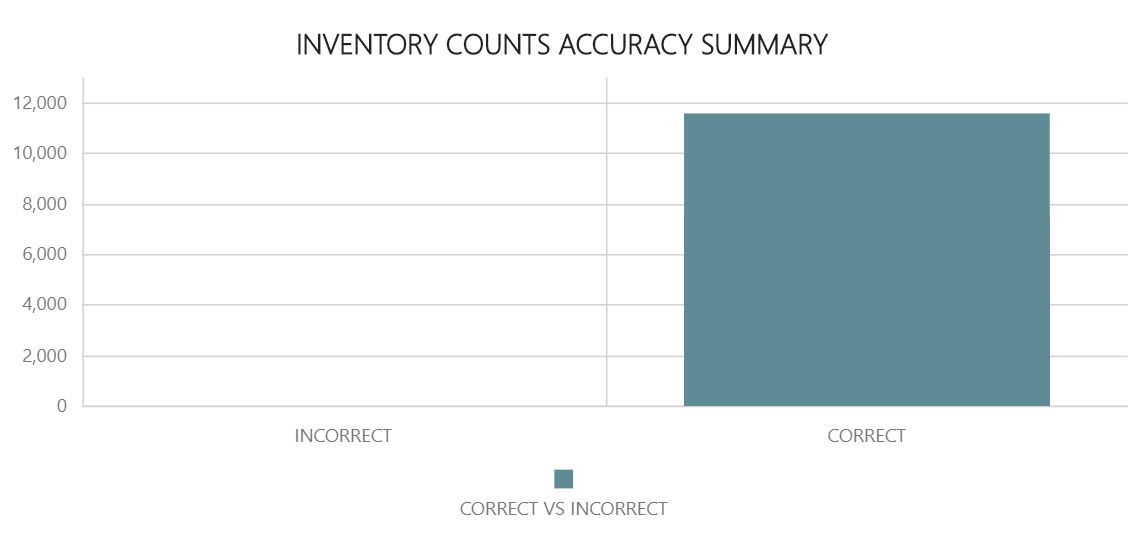
Inventory Counts Accuracy Summary#
Lets you compare a warehouse’s correct count total to the incorrect count total.
Drill down notes: Click on bar to get to Inventory Counts Detailed.
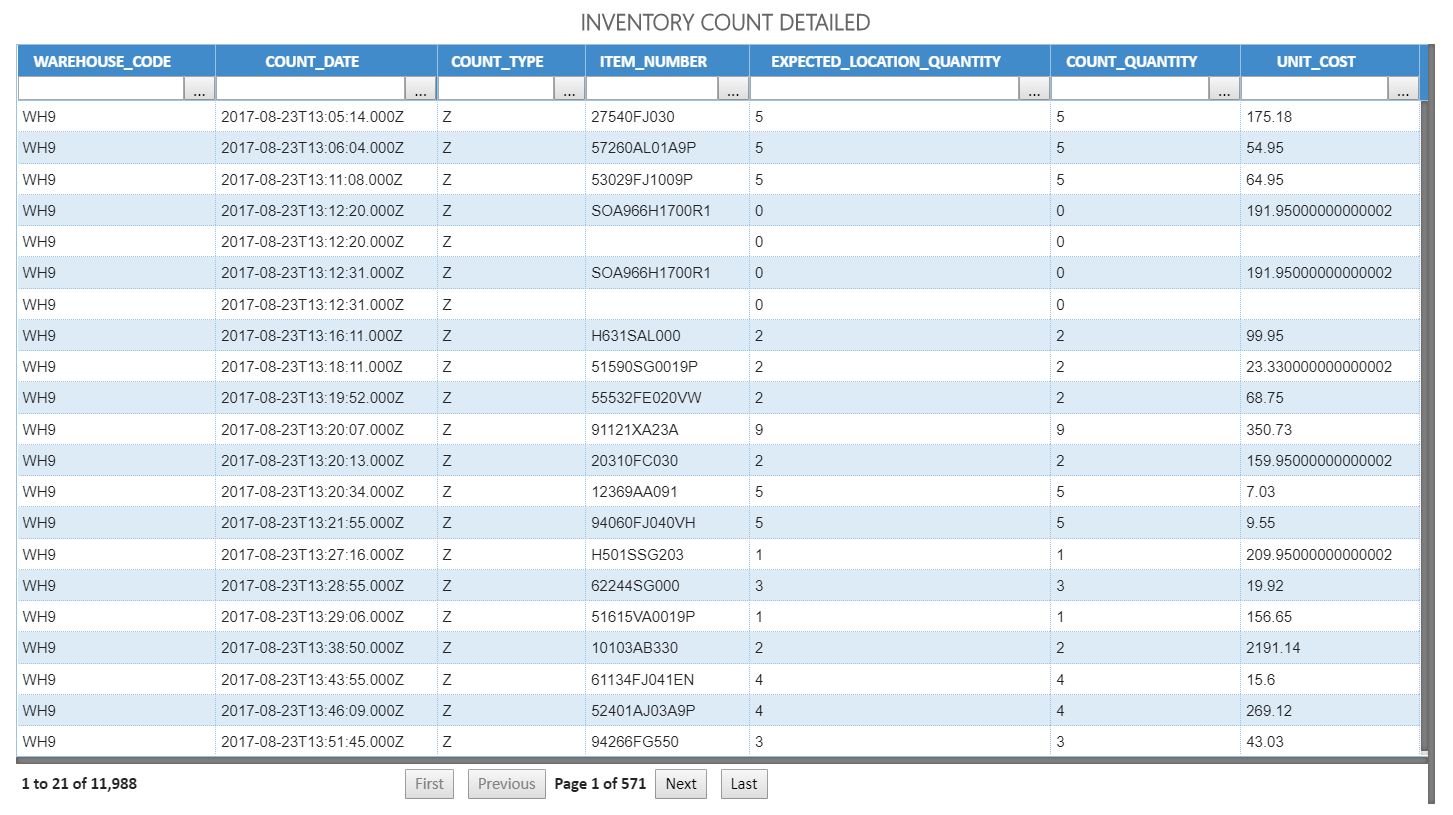
Inventory Counts Detailed#
Shows the details of a warehouse’s inventory counts.
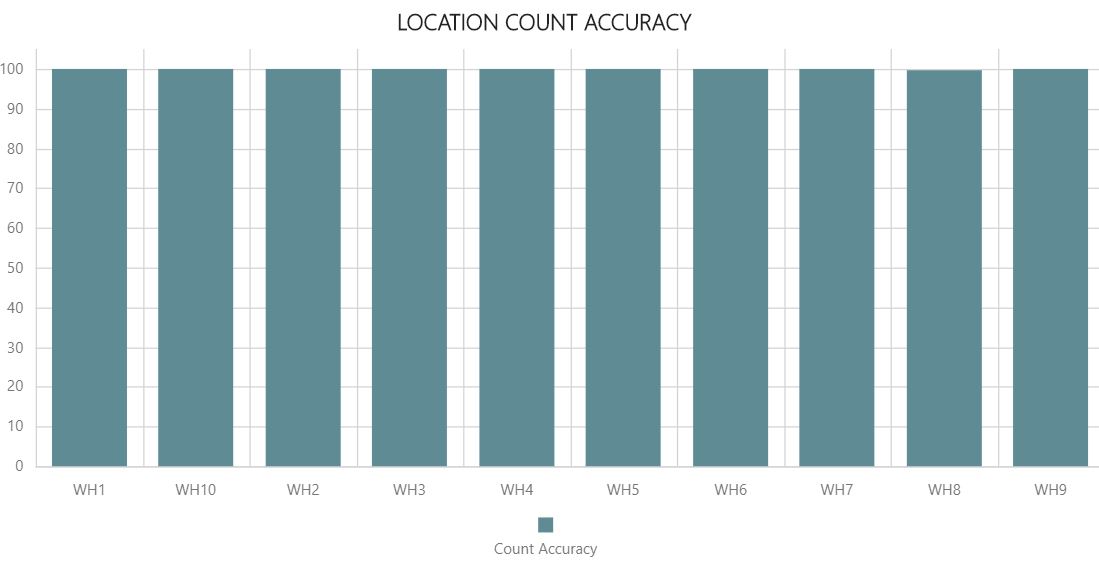
Location Count Accuracy#
Lets you compare the location count accuracy across all warehouses.
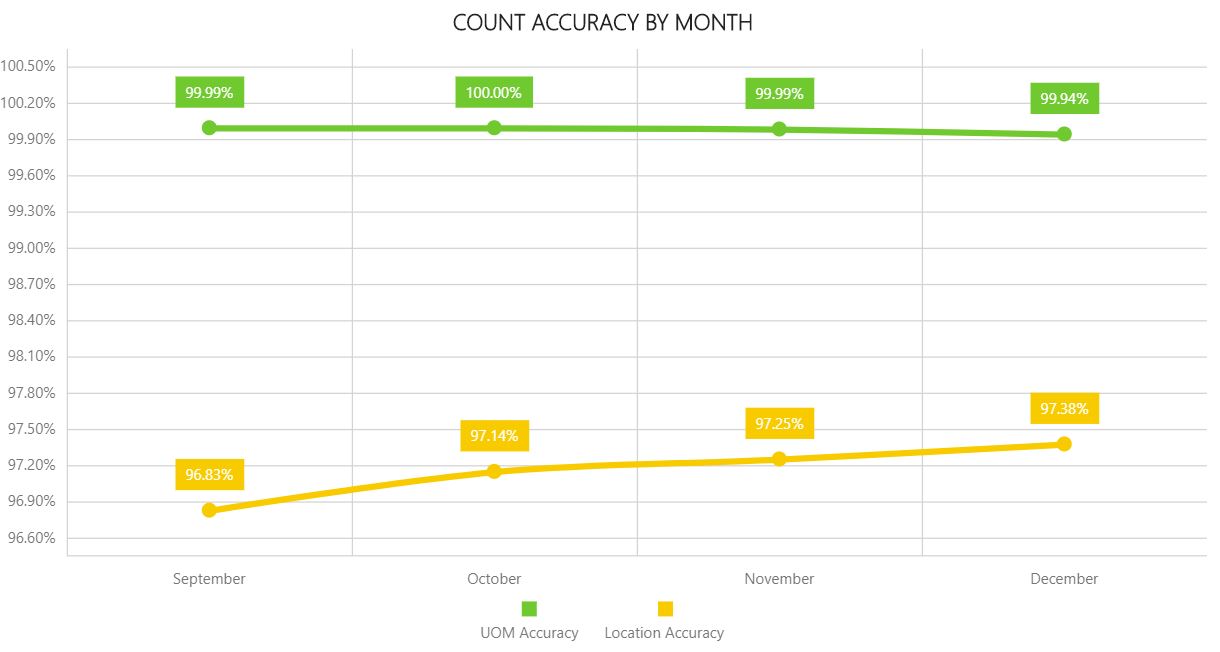
Count Accuracy by Month#
Shows you how count accuracy is trending month over month. One line represents UOM count accuracy and the other represents location count accuracy.
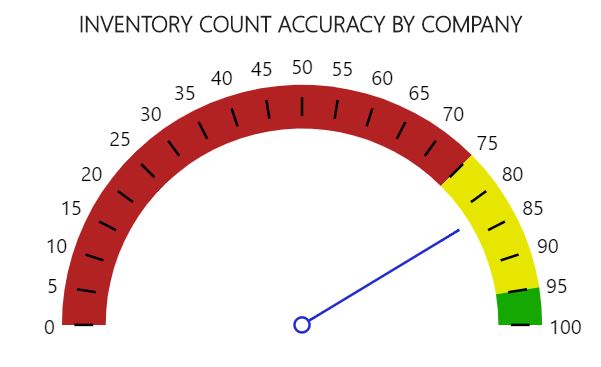
Inventory Count Accuracy by Company#
Shows you the UOM count accuracy of the enterprise during the date range.
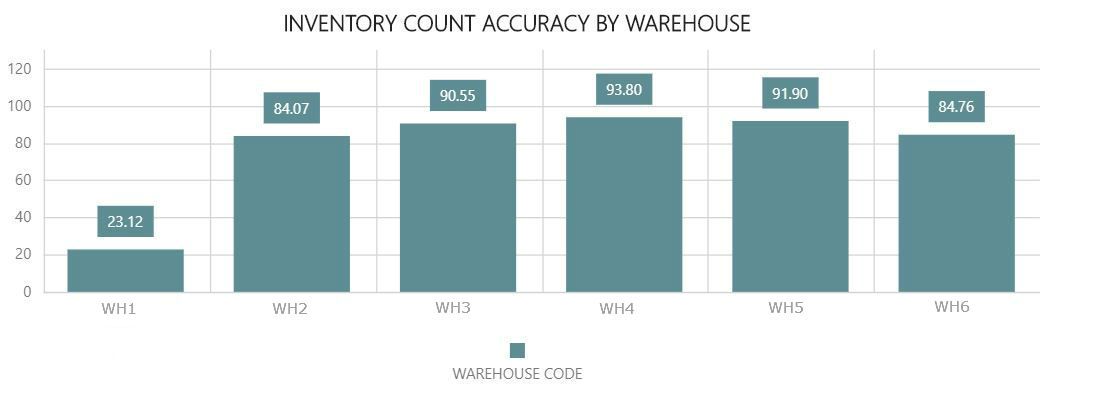
Inventory Count Accuracy by Warehouse#
Lets you compare location count accuracy across all warehouses during the date range.
Inventory - Status#
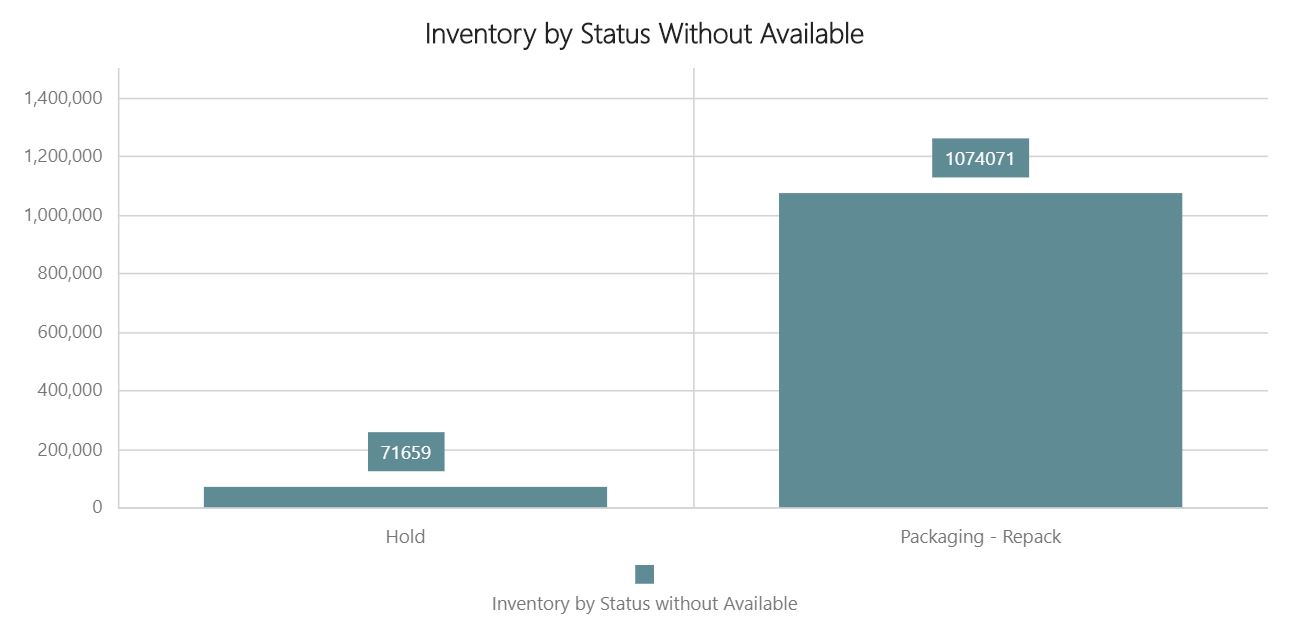
Inventory by Status Without Available#
Lets you see how many inventory units aren’t in Available status and how they break down by status.
Inventory by Status#
Lets you see compare the relative quantities of inventory units at each status.
Labor - Activity Adjustment#
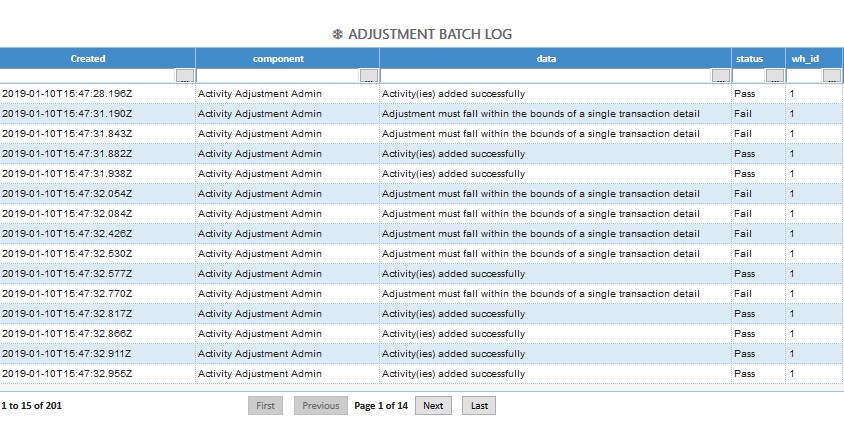
Adjustment Batch Log#
Shows you the details of each activity adjustments including the status of the adjustment and an error message if it failed.

Labor - Hours#
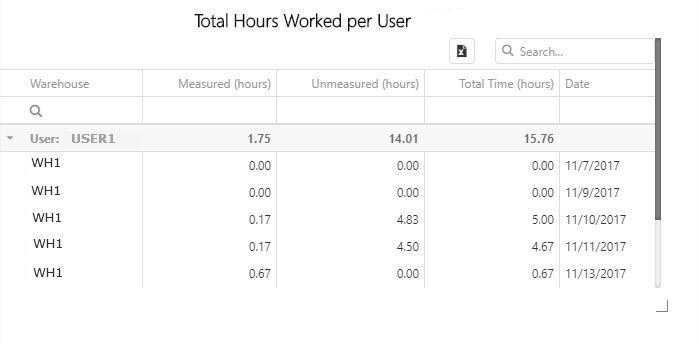
Total Hours Worked#
Shows you the measured hours logged by each user for each day during the widget’s date range.
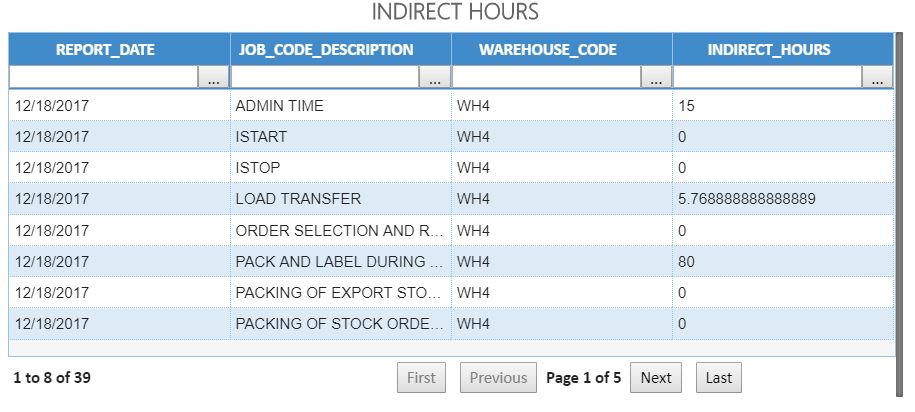
Indirect Hours#
Shows the amount of indirect hours spent on each type of unmeasured activity at a particular warehouse over a specified date range.
Labor Maintenance#
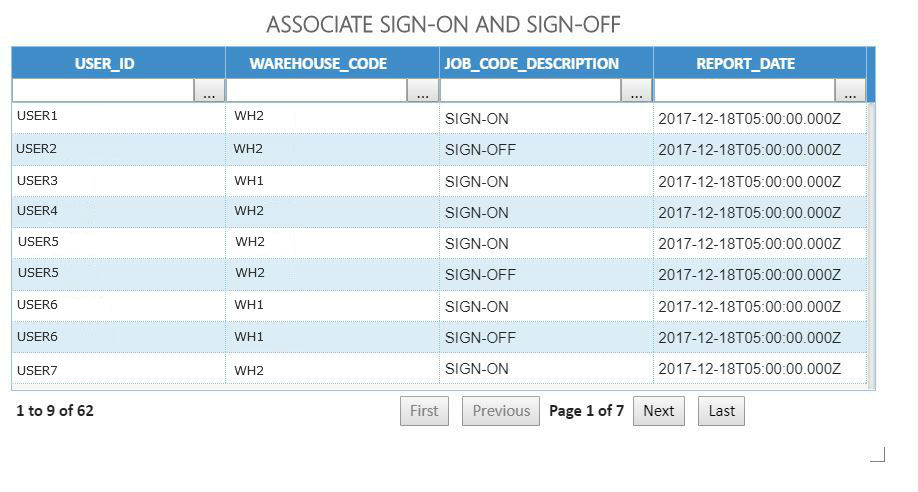
Associate Sign-On and Sign-Off#
Shows you the warehouse and date/time stamp of each user’s sign-on and sign-off transaction during the time period.
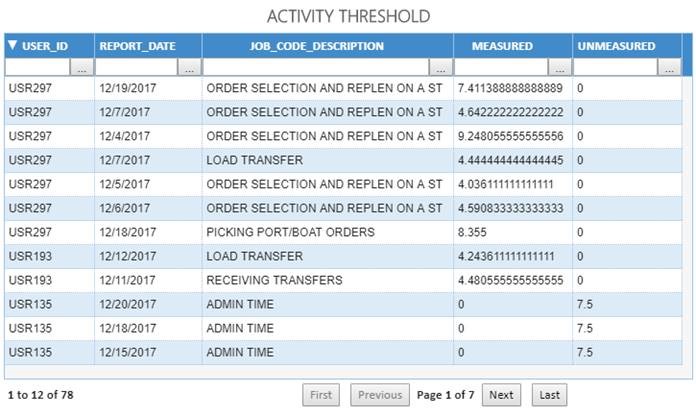
Activity Thresholds#
Shows you details of activities that took longer than a specified time threshold during the specified date range.
Labor Performance#
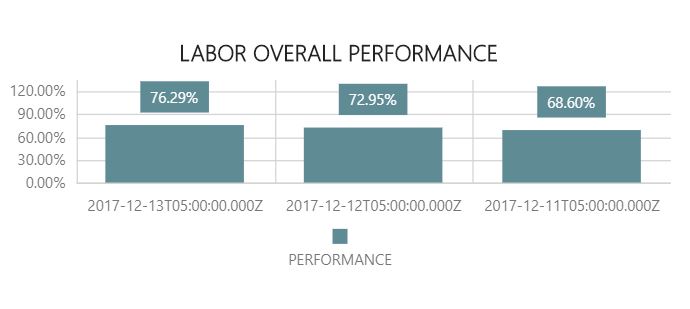
Labor Overall Performance#
Shows you the enterprise-wide labor overall performance for each day during the specified date range.
Drill down notes: Click on a bar to get to Labor Overall Performance by Warehouse
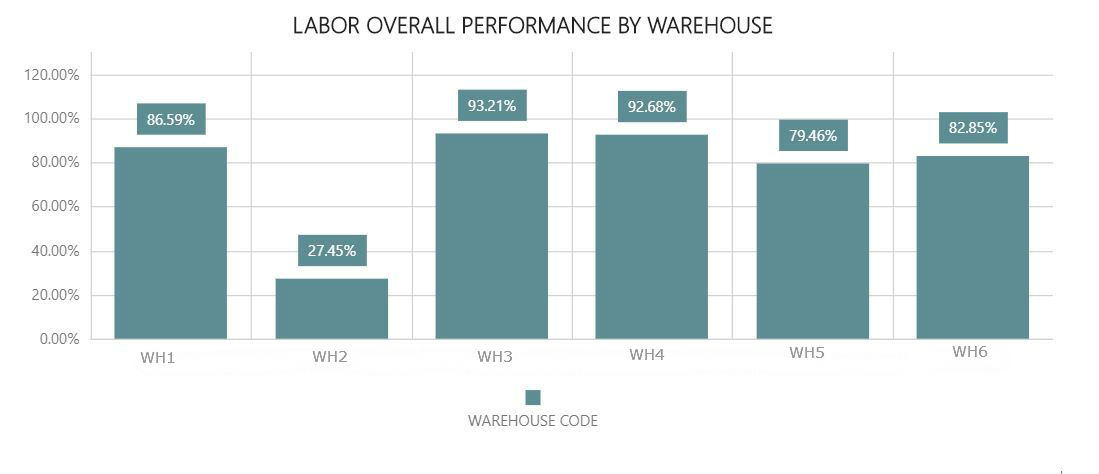
Labor Overall Performance by Warehouse#
Lets you compare labor overall performance across all warehouses during the date range.
Drill down notes: Click on a bar to get to Labor Overall Performance by Shift
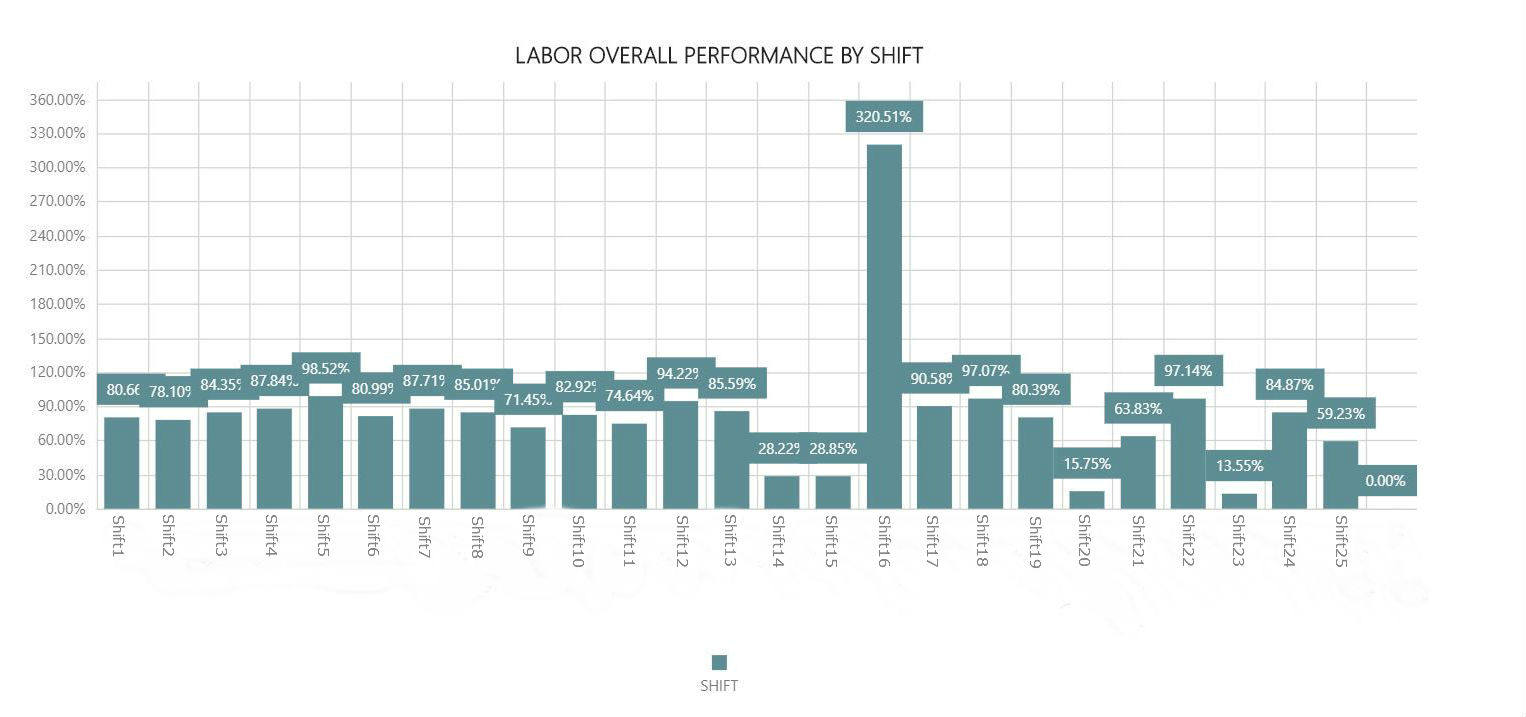
Labor Overall Performance by Shift#
Lets you compare labor overall performance across all shifts at a warehouse during the date range.
Outbound Performance#
Perfect Order Percentage by Company#
Shows you the perfect order percentage across the enterprise over the specified period.
Drill down notes: Click on gauge to get to Perfect Order Percentage by Warehouse.

Perfect Order Percentage by Warehouse#
Lets you compare perfect order percentage across all warehouses over the specified period.
Drill down notes: Click on bar to get to Over or Short Order Details.

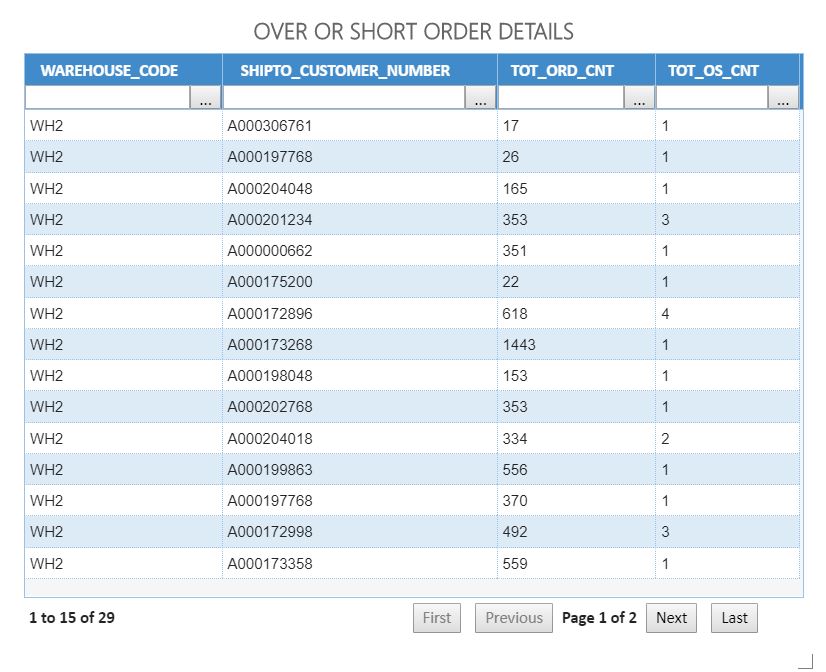
Over or Short Order Details#
Shows details of orders that were shipped with either an overage or a shortage.
Perfect Order Lines Percentage by Company#
Shows you the perfect order line percentage across the enterprise over the specified period.
Drill down notes: Click on gauge to get to Perfect Order Lines Percentage by Warehouse.

Perfect Order Lines Percentage by Warehouse#
Lets you compare perfect order line percentage across all warehouses over the specified period.
Drill down notes: Click on bar to get to Over or Short Order Line Details.

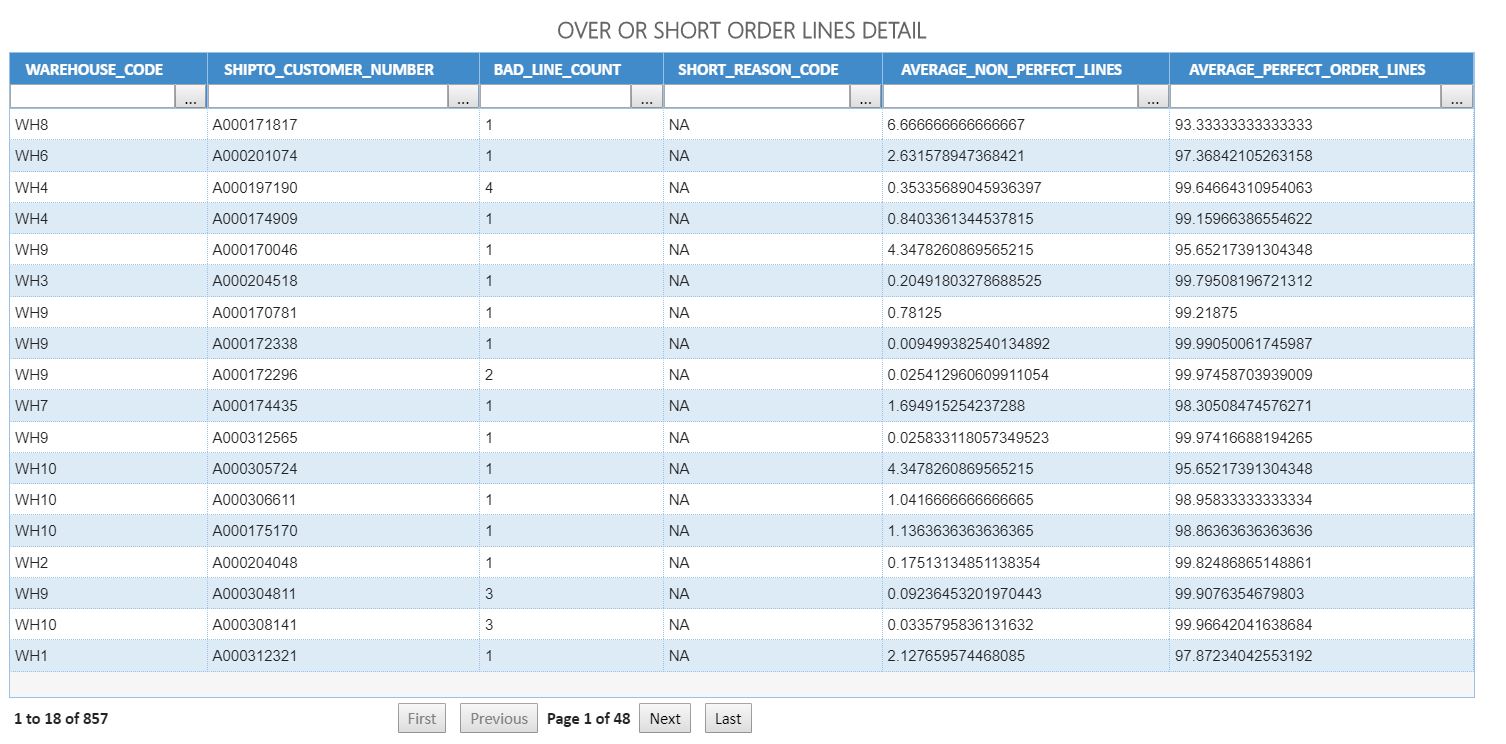
Over or Short Order Line Details#
Shows details of order lines that were shipped with either an overage or a shortage.
Perfect Order Quantity Percentage by Company#
Shows you the perfect order quantity percentage across the enterprise over the specified period. It allows you to easily see whether the ratio has reached or is about to reach a critically low level. For example, if the ratio is lower than your tolerance threshold, you can drill down to the next level in the drilldown series to further investigate on a warehouse level.
Drill down notes: Click on gauge to get to Perfect Order Quantity Percentage by Warehouse.

Perfect Order Quantity Percentage by Warehouse#
Lets you compare perfect order quantity percentage across all warehouses over the specified period.
Drill down notes: Click on gauge to get to Over or Short Quantity Details.

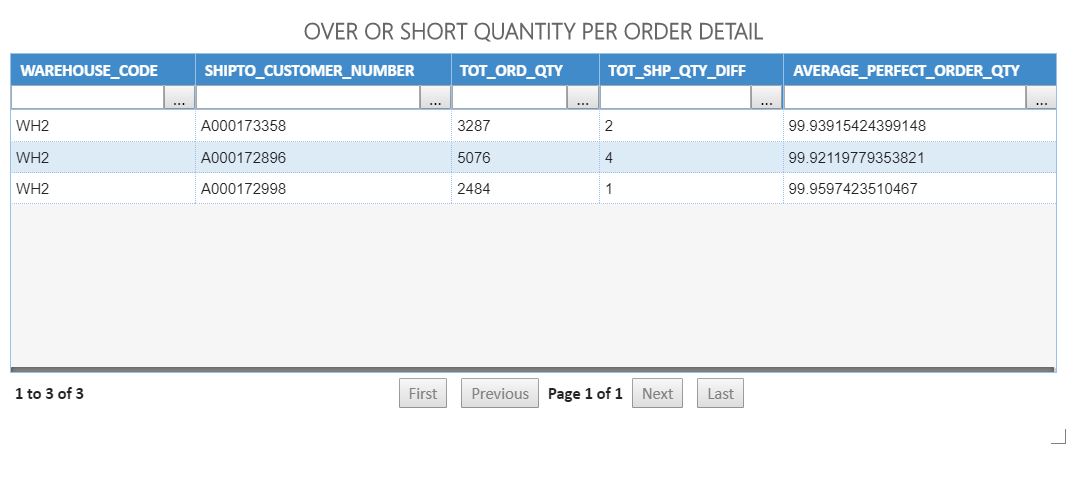
Over or Short Quantity Details#
Shows details of quantities that were shipped with either an overage or a shortage. This means that the shipped amount per order line was either above or below the ordered quantity. The details are per transaction in each warehouse. Monitoring individual transactions is helpful in finding the source of a shipment delay or a pattern in client order behavior or warehouse shipment schedules.
Field |
Description |
|---|---|
WAREHOUSE_CODE |
Warehouse ID – where the order will be filled. |
CLIENT_CODE |
Client ID – The client code that owns the order. In non-3PL system, this value defaults to ‘——’. |
SHIPTO_CUSTOMER_NUMBER |
Customer to which the order will be shipped to. |
SHIPTO_CUSTOMER_NAME |
Customer to which the order will be shipped to. |
ORDER_NUMBER |
Number to identify the order in the system. |
ORDERED_QTY |
Quantity required for this order line. |
SHIPPED_QTY |
Quantity that was shipped for this order line. |
SHIPPED_DIFFERENCE |
Difference between ORDERED_QTY AND SHIPPED_QTY. |
AVERAGE_PERFECT_ORDER_QTY |
Percentage of the perfect order quantity percentage. |
ITEM_NUMBER |
Identifier for the part, item, or SKU that is ordered. |
On-Time Shipments Percentage by Company#
Shows percentage of shipments that shipped on or before the appointment time.
Drill down notes: Click on gauge to get to On-Time Shipments Percentage by Warehouse.

On-Time Shipments Percentage by Warehouse#
Lets you compare the percentage of shipments that shipped on or before the appointment time across all warehouses.

Live Operations#
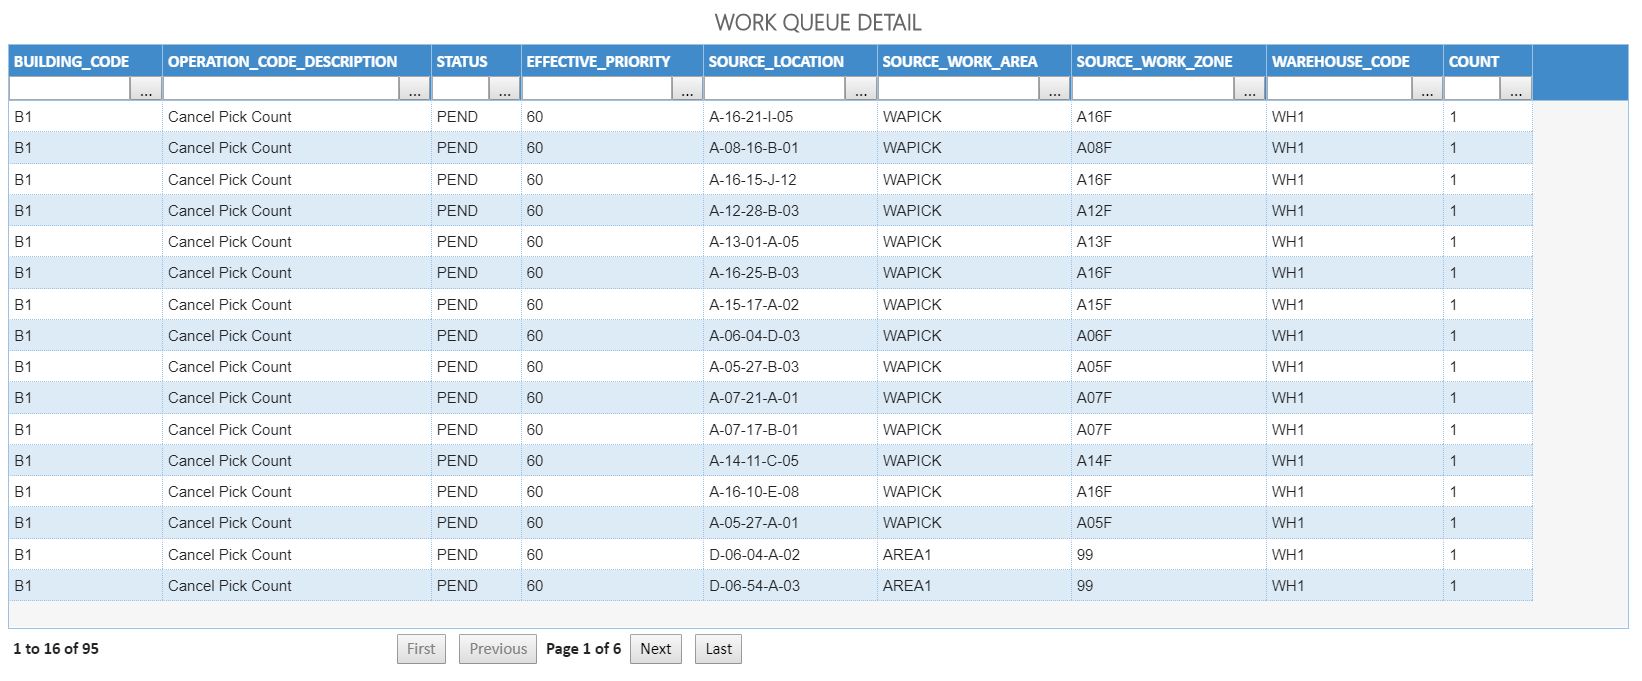
Work Queue Detail#
Shows grid details of work types by operation code and status within a warehouse.
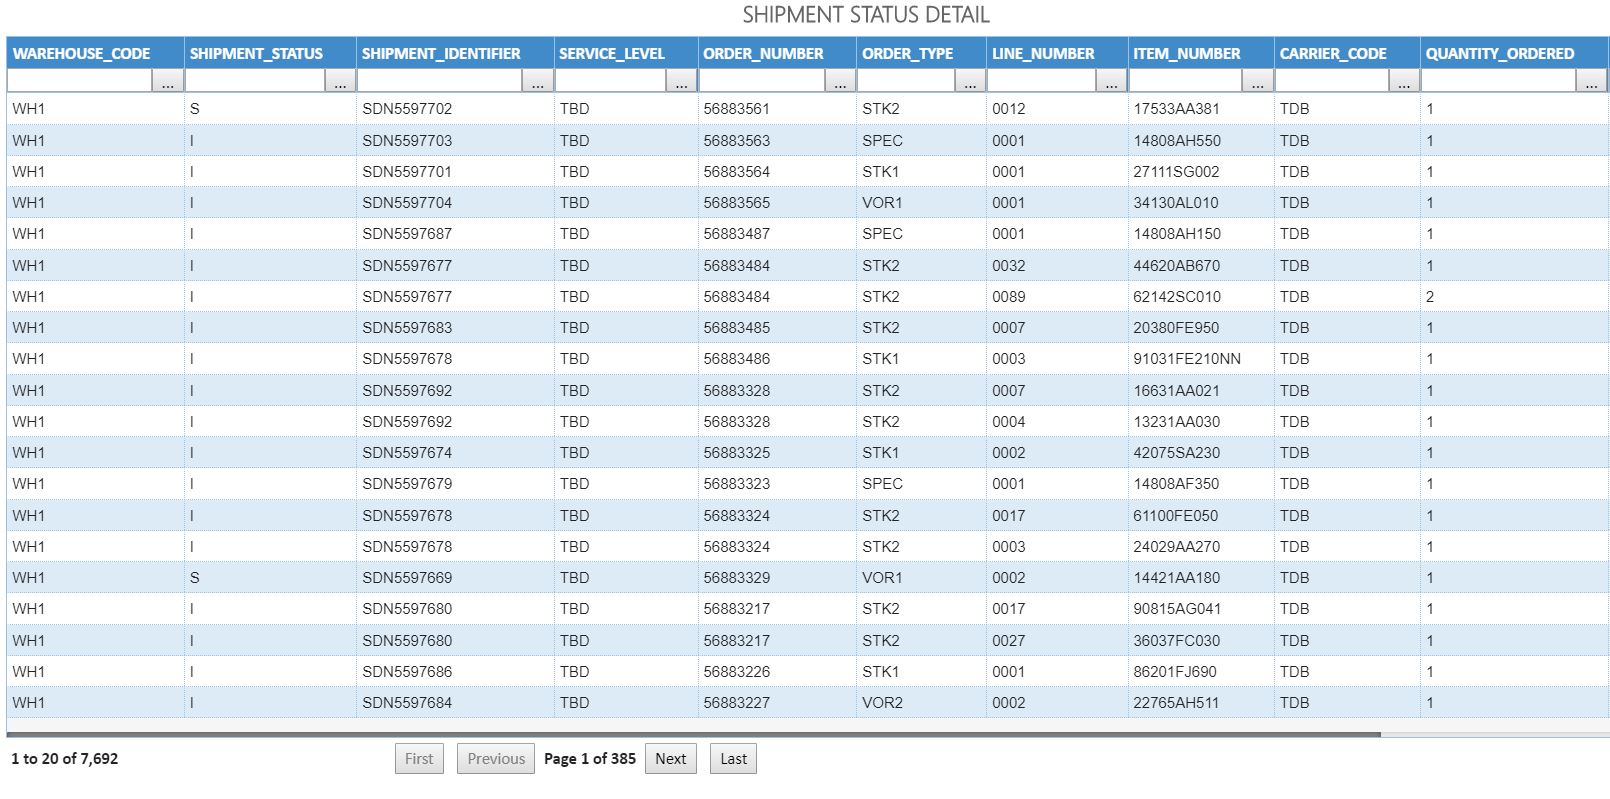
Shipment Status Detail#
Shows details of shipment status for open orders.
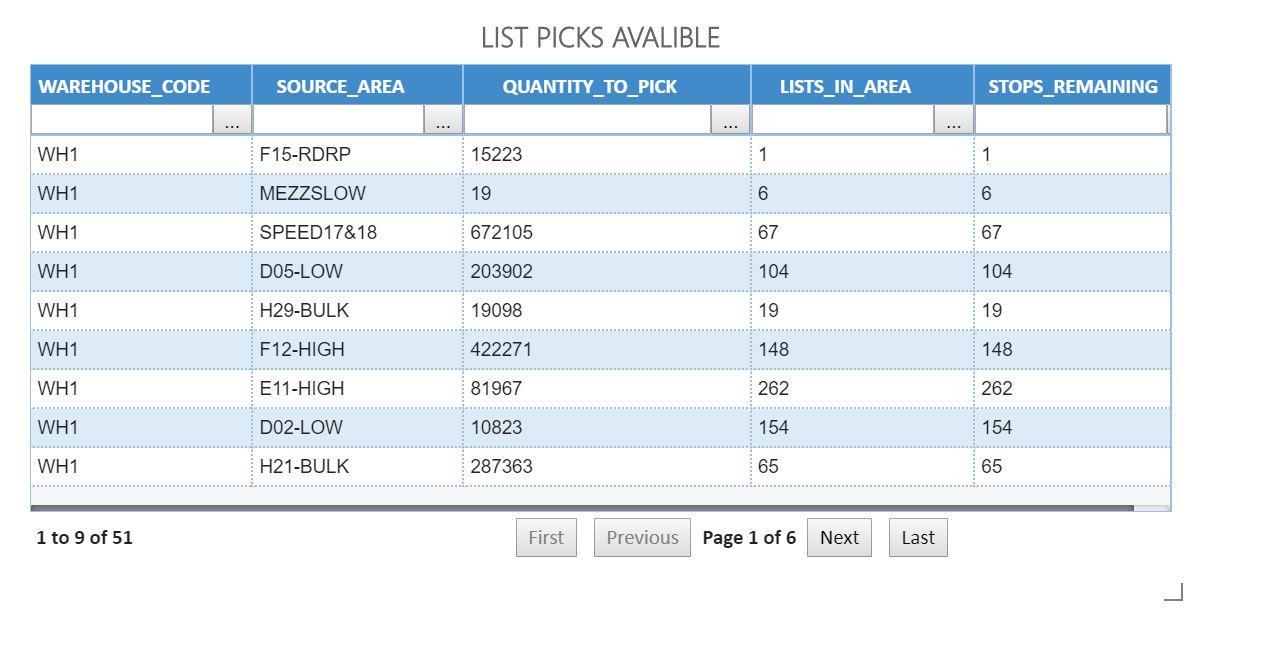
List Picks Available#
Shows details of picks by count of list, lines, and cases.
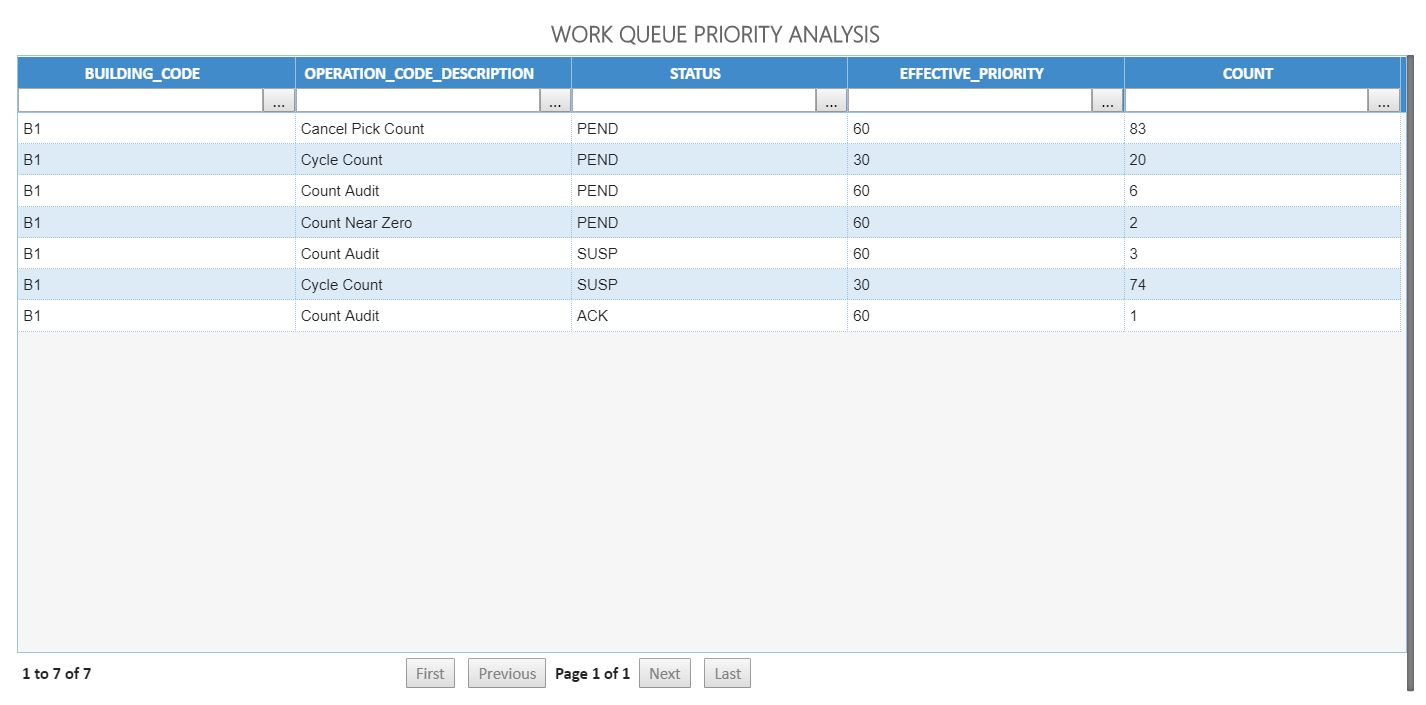
Work Queue Priority Analysis#
Shows summary for tasks by operation code, status, and priority.
Total Orders Today Tool#
Shows shipment status of all orders that are in the system today. You can see shipment details for all orders that are not complete or that are cancelled and how long has the order been placed but not shipped.
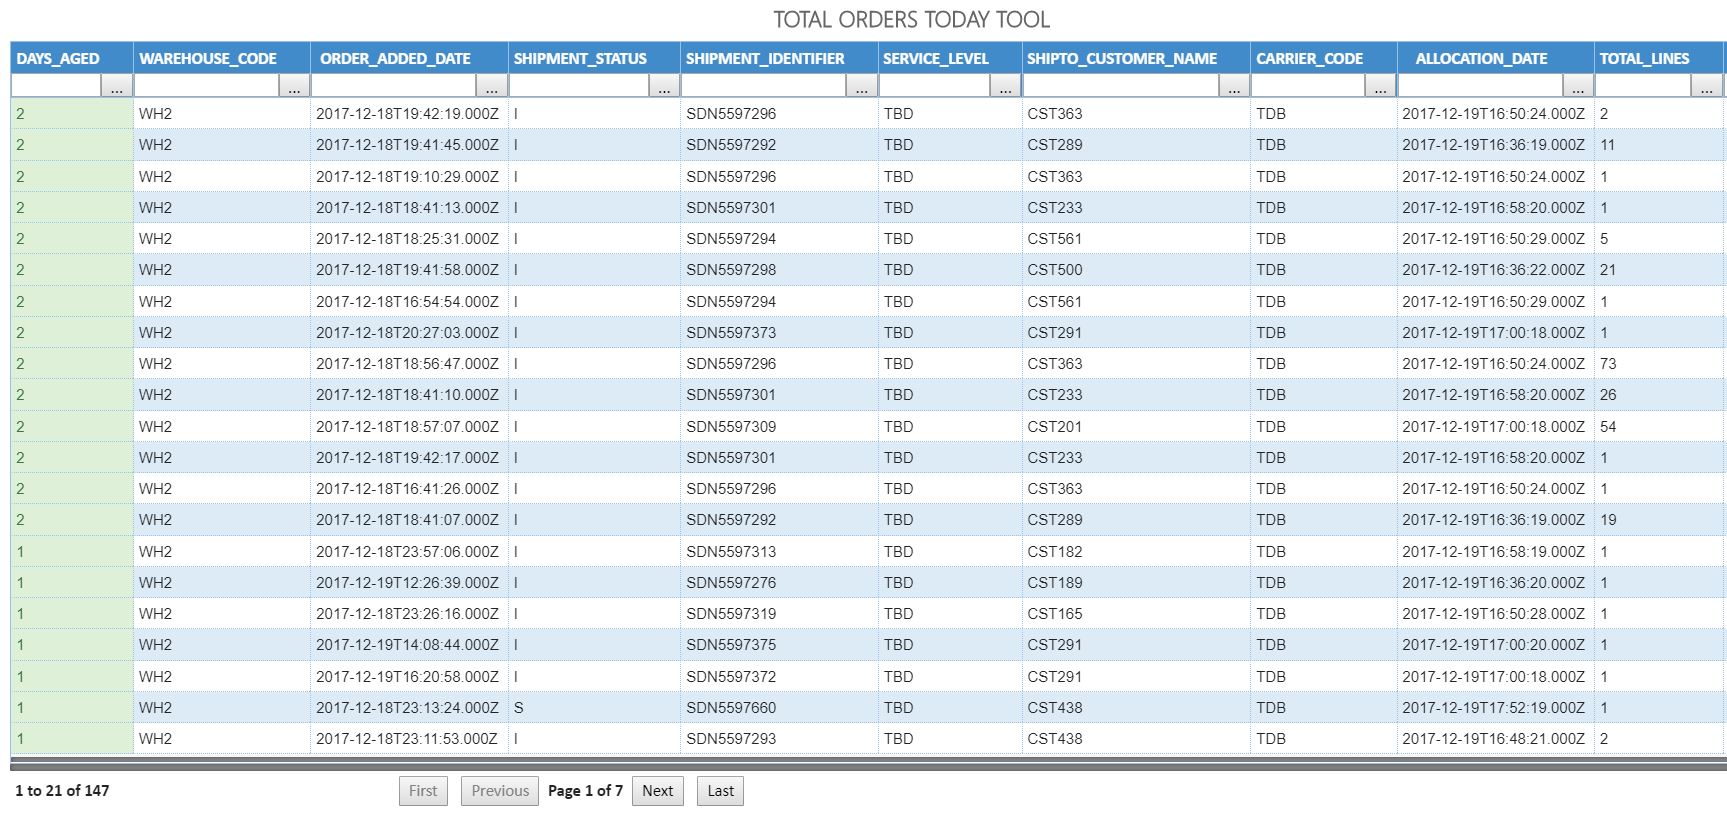
Field |
Description |
|---|---|
DAYS_AGED |
Counts the number of days since the date the order as added. |
WAREHOUSE_CODE |
Warehouse ID – where the order will be filled. |
ORDER_ADDED_DATE |
Date the order was added to the system. |
SHIPMENT_STATUS |
Status of shipment. |
SHIPMENT_IDENTIFIER |
Shipment identifier. |
SERVICE_LEVEL |
Code of service level of the carrier. |
SHIPTO_CUSTOMER_NAME |
Customer to which the order will be shopped to. |
CARRIER_CODE |
Code of the carrier that will ship the order. |
SHIP_DATE_EARLIEST |
First day of the shipment range. |
SHIP_DATE_LATEST |
Last day of shipment range. |
STAGE_DATE |
Timestamp of when the order was staged. |
LOADED_DATE |
Timestamp of when the order was loaded. |
ALLOCATION_DATE |
Date the inventory as allocated to the order. |
TOTAL_LINES |
Total number of lines. |
TOTAL_CASES |
Total number of cases. |
Transaction Summary#
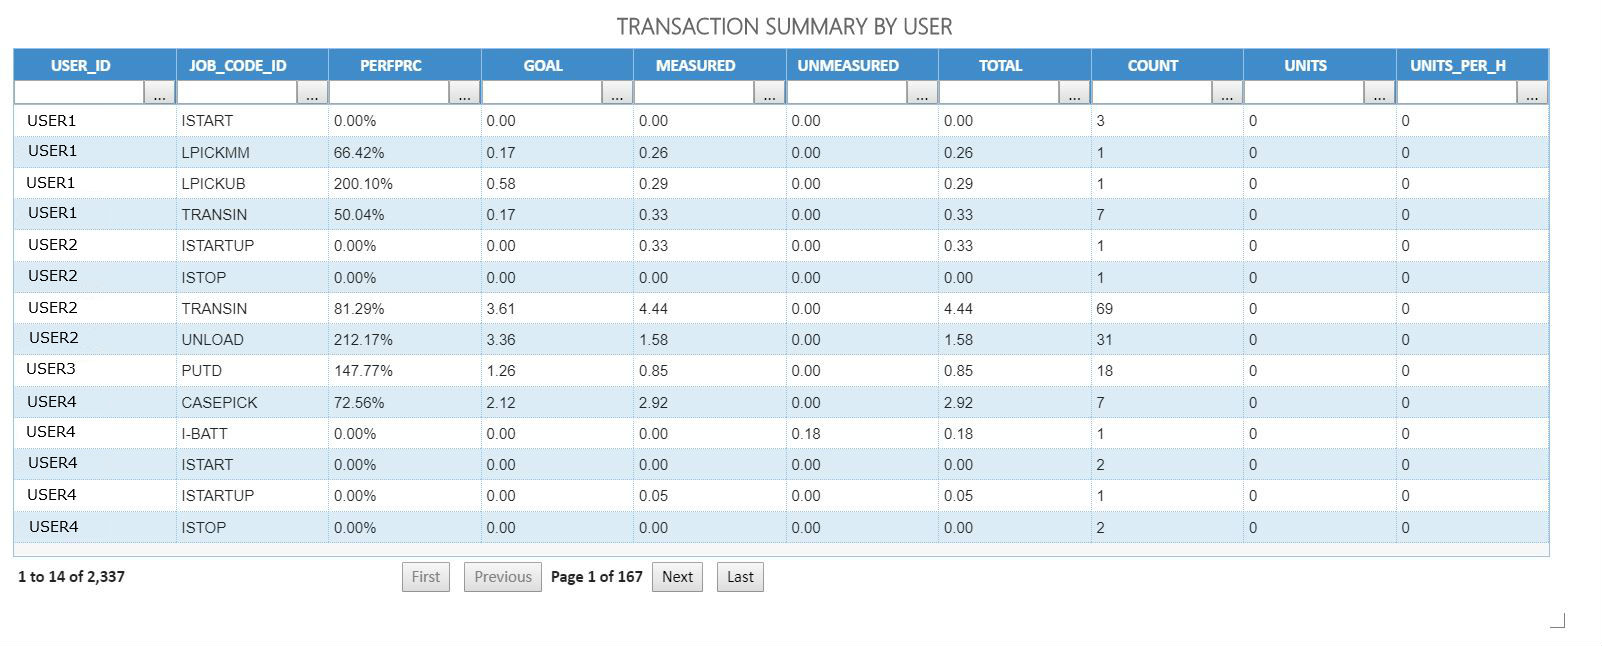
Transaction Summary by User#
Shows you the details of each user’s activities recorded in the WLM during the time period including measured hours and performance percentage.
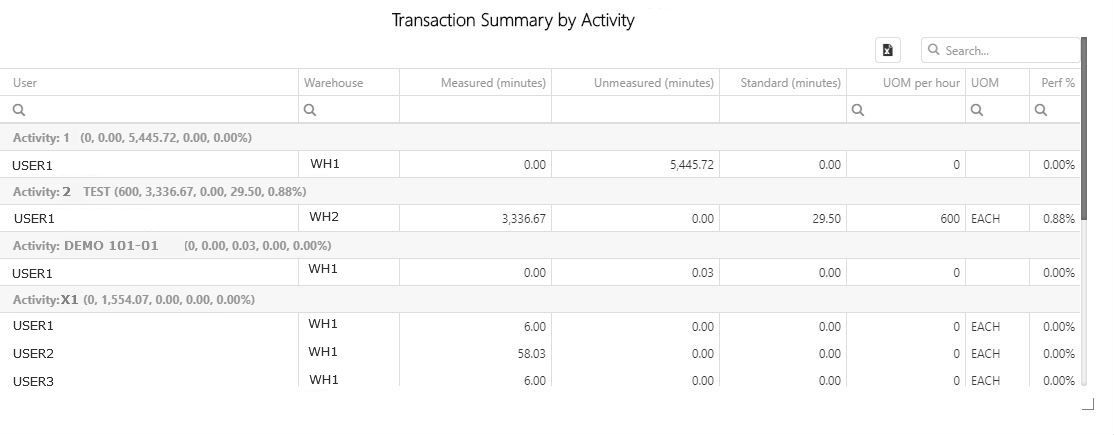
Transaction Summary by Activity#
Shows you the details of all the transactions logged in the WLM during the time period grouped by activity code.
Drill Down Sequences#
Labor Performance#
Level |
Widget |
|---|---|
1 |
|
2 |
|
3 |
Outbound Performance#
Level |
Widget |
|---|---|
1 |
|
2 |
|
3 |
- ::
Level |
Widget |
|---|---|
1 |
|
2 |
|
3 |
- ::
Level |
Widget |
|---|---|
1 |
|
2 |
|
3 |
- ::
Level |
Widget |
|---|---|
1 |
|
2 |
Cycle Time#
Level |
Widget |
|---|---|
1 |
|
2 |
- ::
Level |
Widget |
|---|---|
1 |
|
2 |
Inventory#
Level |
Widget |
|---|---|
1 |
|
2 |
|
3 |
- ::
Level |
Widget |
|---|---|
1 |
|
2 |
|
3 |
|
4 |