Release 38.2 Notes 15 October 2023#
Summary#
In this release, we’ve developed the following improvements:
In the 3PL Billing module, you can now export invoices as PDFs.
In the Labor Planning module, you can now set up a forecast instance so that tracking executes automatically and its progress tracking tables are automatically refreshed every 10 minutes with current data.
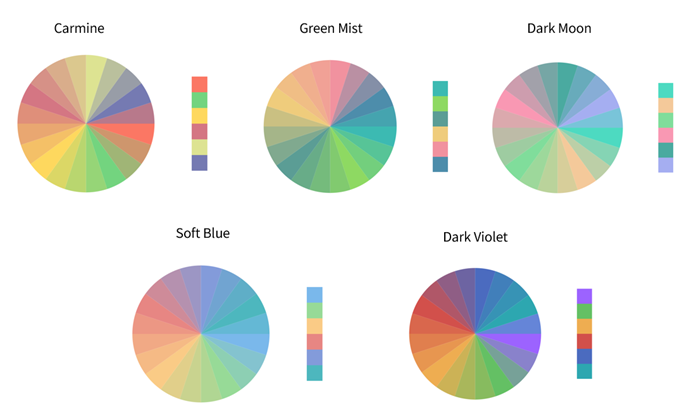
In Chart Designer, five new color palette options have been added to the palette property.
Also, eight chart properties have been deprecated and replaced with new properties.
3PL Billing Module Improvements#
Exporting Invoices as PDFs#
Through the 3PL billing module’s Invoice Configuration screen, you can now export an invoice to PDF. A new ‘Export As…’ button has been added to the screen header. Clicking the button opens a dropdown menu that has a PDF option.

Note
 To export an invoice to PDF, the invoice must be configured with a template for generating a PDF.
Setting up an Invoice Configuration to Generate a PDF#
Go to Admin Tools -> Billing > Client Configuration.
Select a Client on the ‘General’ Tab, then navigate to the ‘Invoice’ Tab .
Select (or create) an Invoice configuration in the left nav.
In the dropdown field ‘PDF Template’, select ‘JBDetailed’, and then save the configuration.
The invoice is now configured to be exported as a PDF using the JBDetailed PDF template.
Exporting an Invoice as a PDF#
Go to Admin Tools -> Billing -> Invoice Configuration. You are at the Invoice Configuration screen.
From the ‘Select a Client’ dropdown, select the client whose invoices you want to see.
Click the invoice that you want to export.
Click on the ‘Export As…’ button dropdown, then select ‘PDF’. A modal window opens that has a PDF Invoice.
Click the ‘Print’ button dropdown above the PDF preview, then select ‘Print to PDF’. Your browser’s print dialog opens.
Click the ‘Save’ button. You are prompted to select a name and location on your computer to download your PDF to.
Labor Planning Module Improvements#
Automated Tracking of Forecast Instances#
You can now set up a forecast instance so that tracking executes automatically and its progress tracking tables are automatically refreshed every 10 minutes with current data.
Previously, you had to execute tracking manually from the Forecast Execution screen and the progress tracking tables would not be automatically refreshed with current data.
This release changes the Forecast Execution screen so that each forecast instance’s Actions field has a new item. This item looks like a star and has three states, which you can toggle through by clicking the star:
Empty star - Disabled. Tracking has never been enabled on this instance.
Gold star - Enabled and Tracking. Progress Tracking tables are generated for the forecast instance and they are refreshed with current data every 10 minutes.
Grey star - Previously tracked forecast instance whose tracking is now disabled.
To enable tracking on a forecast instance, all the following must be true:
No other forecast instance has tracking enabled.
The forecast instance status must be completed.
The forecast instance’s date range is 7 days or less.
The forecast end date has not yet passed.
Tracking lets you compare the forecast to current data and evaluate the forecast’s accuracy. For example, if your forecast instance says that your team will have 10,000 pallets shipped by the end of next week, tracking shows you how many pallets you have shipped so far and how close you are to meeting the forecast quantity.
Chart Designer Changes#
Removing Deprecated Chart Properties#
We’ve removed deprecated chart properties of the following chart types:
Area, Stacked Area, Full Stacked Area
Bar, Stacked Bar, Full Stacked Bar
Line, Stacked Line, Full Stacked Line
Spline, Spline Area
Range Area
Range Bar
Step Line
Step Area
Bubble
Each deprecated property has a replacement property. The following table lists the old property, their replacement property, and the replacement property’s description. For more information on chart properties, see Advanced Design through Chart Properties. Deprecated properties already set up in your widgets’ chart properties panel remain; but once you remove them from the panel, they cannot be re-added.
Removed Property |
Replacement Property |
Description |
|---|---|---|
equalBarWidth |
commonSeriesSettings > ignoreEmptyPoints |
Specifies whether a chart ignores null data points or not. By default, if a data source has data points with a null argument or value, a chart may draw series with unnecessary gaps between points. To prevent this behavior from occurring, set the ignoreEmptyPoints option to true. |
useAggregation |
commonSeriesSettings > aggregation |
Specifies whether to filter the series points depending on their quantity. By default, a chart displays all series points, but to improve performance you may want to aggregate the series points rather than display them all. |
scrollingMode, zoomingMode |
zoomAndPan |
Lets you control the zooming and panning capabilities in your chart. By default, this capability is off and must be selected for either the argument or the value axis, or both. You can define the range within which zooming and panning is allowed under the wholeRange property. For more information on the zoomAndPan property, see Widget Properties, under the Chart tab and then Design section. |
valueAxis > min |
valueAxis > visualRange > startValue |
Specifies the axis’ displayed range. The start value that should be displayed at the chart’s start, regardless of the data value. |
valueAxis > max |
valueAxis > visualRange > endValue |
Specifies the axis’ displayed range. The end value that should be displayed at the chart’s end, regardless of the data value. |
argumentAxis > min |
argumentAxis > visualRange > startValue |
Specifies the axis’ displayed range. The start value that should be displayed at the chart’s start, regardless of the data value. |
argumentAxis > max |
argumentAxis > visualRange > endValue |
Specifies the axis’ displayed range. The end value that should be displayed at the chart’s end, regardless of the data value. |
Five New Color Palettes#
The following color palettes have been added as options in the ‘palette’ property in the Chart Designer:
Carmine
Green Mist
Dark Moon
Soft Blue
Dark Violet

These palettes can be applied to the following charts:
Area, Stacked Area, Full Stacked Area
Bar, Stacked Bar, Full Stacked Bar
Line, Stacked Line, Full Stacked Line
Spline, Spline Area
Range Area
Range Bar
Step Line
Step Area
Bubble
The ‘palette’ property sets the palette to be used for colorizing series and their elements. This property is overridden by the ‘commonSeriesSettings’ or the individual ‘series’ settings.

Bug Fixes#
Widget Builder#
Design Chart - Grid based widgets show wrong property type after 20 columns
Getting Console Error when user tries to create a new widget
Dashboards#
Range date is not parsed properly on dashboards
Fiscal Dates not working on local Dates
Favourites- Long Title exceeds in the Please Confirm window frame when user tries to delete a widget
3PL Billing#
Transactions created from incubation are missing attributes
Warehouse Mapping#
Default Template Layer ‘Active’ for Newly Placed Widgets
Labor Planning#
Forecast Tracking - Forecasted % always displays 0 if there is no tracking FD