Advanced Setup - Functions
This page covers how to use functions to build widgets with advanced features in the widget builder stages and the chart designer .
Formatting Numbers in Grids
You can have grid widgets present numbers according to a specified format (e.g., rounded to two decimal places or shown as dollars). To do this, go to the widget’s Chart Properties and apply a valueFormatterWidgetFunction to the column whose values you want formatted.
Go to Administration -> Widget Administration -> Widget Builder.
If the widget you want to edit is still ‘Active’ (denoted by a green circle), make sure that it’s deactivated.
Select the grid widget whose data you want to format and then click ‘Design Chart’ at the bottom of the screen. You are at the widget’s Chart Properties. The widget’s data is displayed as a grid.
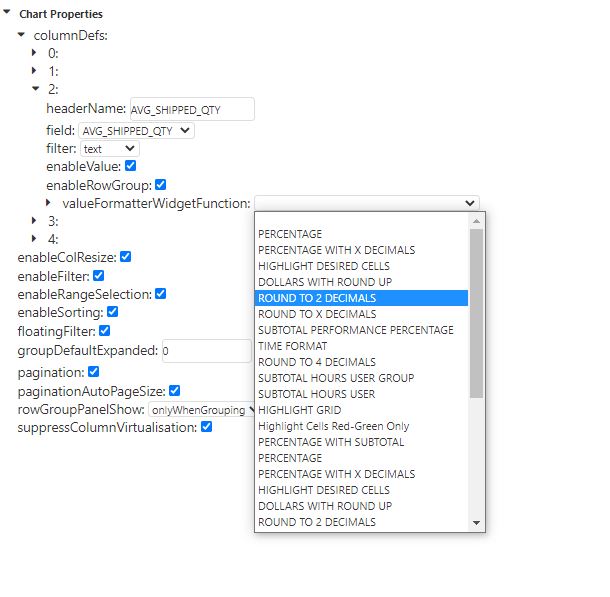
Note the column whose data you want to change and the numerical order in which it’s placed relative to other columns. The first column on the left is considered to be column ‘0’, the next one to the right is column ‘1’, and so on.
In the Chart Properties menu, click the ‘columnDefs’ property. The property expands and a set of numbers appears. Each number represents a column.
Select the number representing the column whose data you want to format. The column’s customizable properties appear.
If there is no ‘valueFormatterWidgetFunction’, manually add it.
From the valueFormatterWidgetFunction’s dropdown, select the formatting function that you want to apply:
Note
 Your environment may not have all the formatting functions shown in the screenshot above. If you would like a custom formatting function added to your Rebus environment, please contact Rebus Customer Support.
Click ‘Save’. The widget is saved. The data in the updated column is re-formatted according to the logic of the specified formatting function.
Adding Hyperlinks to Grid Widgets
In the widget builder, you can set up a grid widget to display a hyperlink.
In the Selecting the Display Field stage, set up a calculated field using the ‘concatenate’ function and enter the link that you want to add.
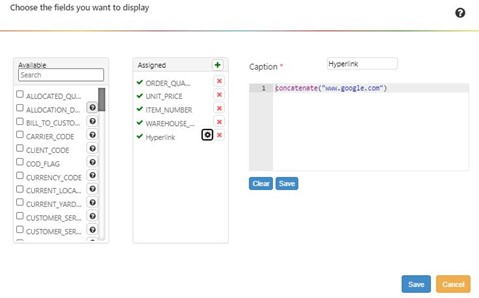
Finish configuring your widget and make sure you select ‘Grid’ in the chart wizard.
Go to the widget’s chart properties panel and expand the ‘columnsDefs’ property. Each column of the grid is identified by an integer with ‘0’ representing the first column. These child properties help configure the way the columns in the chart look and behave.
Expand the drop-down menu for the column containing the calculated field that you created by clicking on the arrow next to its number.
Click the ‘+’ sign next to the column’s number.
Select the ‘cellRenderedWidgetFunction’ property and click ‘ok’.
From the drop-down menu, select one of the two following functions:
Function |
When to Select It |
|---|---|
hyperlinkCell |
For URLs that include https:// |
hyperlinkCellWithoutSecureProtocol |
For URLs that don’t include https:// |
Click ‘Save’.
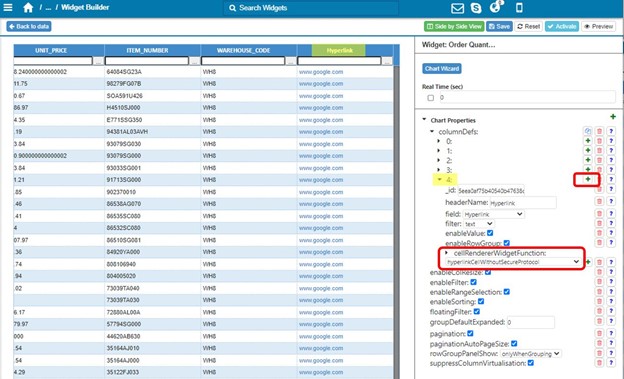
Result: Your widget will show a hyperlink that will open in a new tab.
Replacing Database Values with Descriptive Labels
In the widget builder, you can create a widget that shows descriptive labels instead of the raw, single-character or abbreviated values stored in the WMS: Create a calculated field in which an equals function and a condition function turn values into descriptive labels in the widget. The equals function evaluates whether the field’s value matches a specific value you want to replace with a descriptive label. If it’s a match, the function will return a value of ‘TRUE’. Otherwise it will return ‘FALSE’. The equals function passes either TRUE or FALSE to a condition function, which shows a specified label for TRUE instances and takes another action for FALSE instances. For a description of the equals function and the condition function see Widget Building Function Reference.
Example: Replacing a Single Value with a Descriptive Label
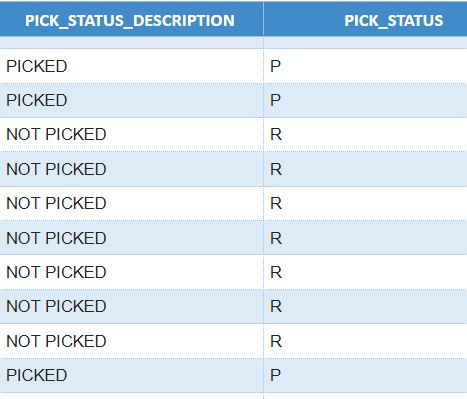
In the following example, we’ll set up a calculated field that shows “PICKED” whenever the PICK_STATUS value is “P”.
In the Selecting the Display Fields stage, set up a calculated field called PICK_STATUS_DESCRIPTION that has a condition function that determines what the field displays. Nested in the condition function is an equals function that returns TRUE when the field’s value matches the value, “P”, that you want to be replaced by a descriptive label.:
condition(equals(PICK_STATUS,"P"), "PICKED", "NOT PICKED")
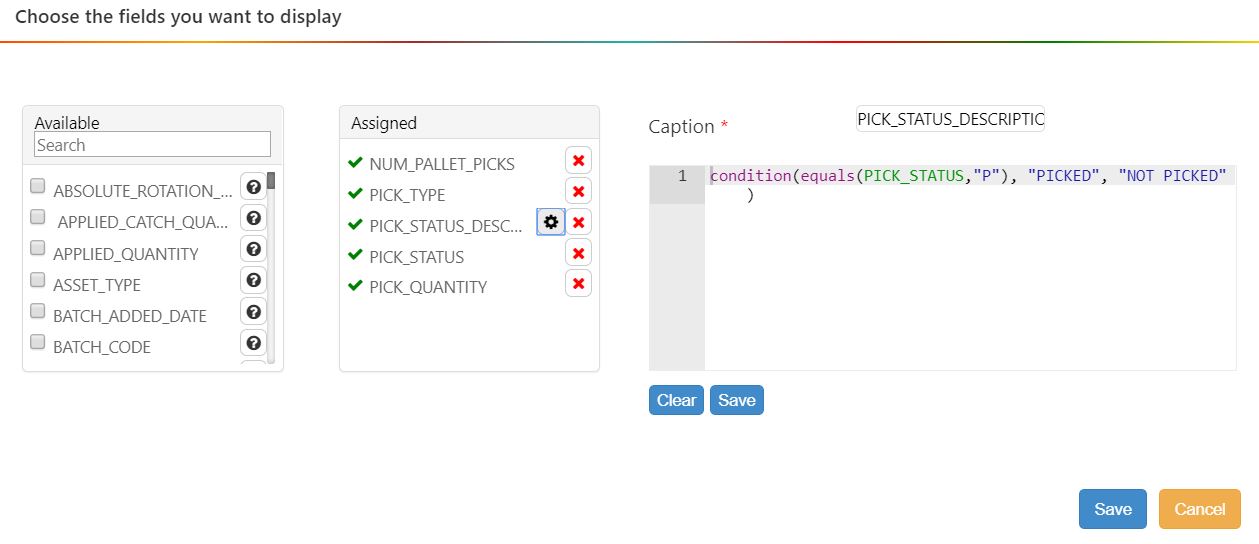
The condition function ensures that PICK_STATUS_DESCRIPTION shows “PICKED” whenever the PICK_STATUS value is “P”. Otherwise, it shows “NOT PICKED”; That’s what the condition function is configured to return if the nested equals function returns FALSE.
Example: Replacing Multiple Values with Descriptive Labels
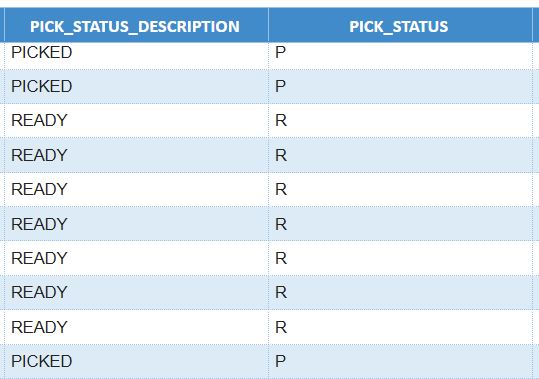
In the previous example, the calculated field shows one of two descriptive labels, “PICKED” or “NOT PICKED” depending on whether the PICK_STATUS value is “P”. If you want to replace a field’s entire range of values with descriptive labels, set up a series of nested condition functions, one for each value that you want to be replaced. In the following example, we’ll be setting up a series of nested condition functions to replace all PICK_STATUS values with descriptive labels:
PICK STATUS value |
Descriptive Label |
|---|---|
P |
PICKED |
R |
READY |
S |
STAGING |
–
In the Selecting the Display Fields stage, set up a calculated field called PICK_STATUS_DESCRIPTION that has condition functions that determine what the field displays for each possible value that PICK_STATUS can have.
The condition functions are nested within each other so that the field value is evaluated against each condition function in sequence. If a condition function evaluates to FALSE, the value will then be evaluated against the next condition function until one evaluates to TRUE or all the options are exhausted and “NOT RECOGNIZED” has to be returned.
condition(equals(PICK_STATUS,"P"), "PICKED", condition(equals(PICK_STATUS,"R"), "READY", condition(equals(PICK_STATUS,"S"), "STAGING", "NOT RECOGNIZED")))
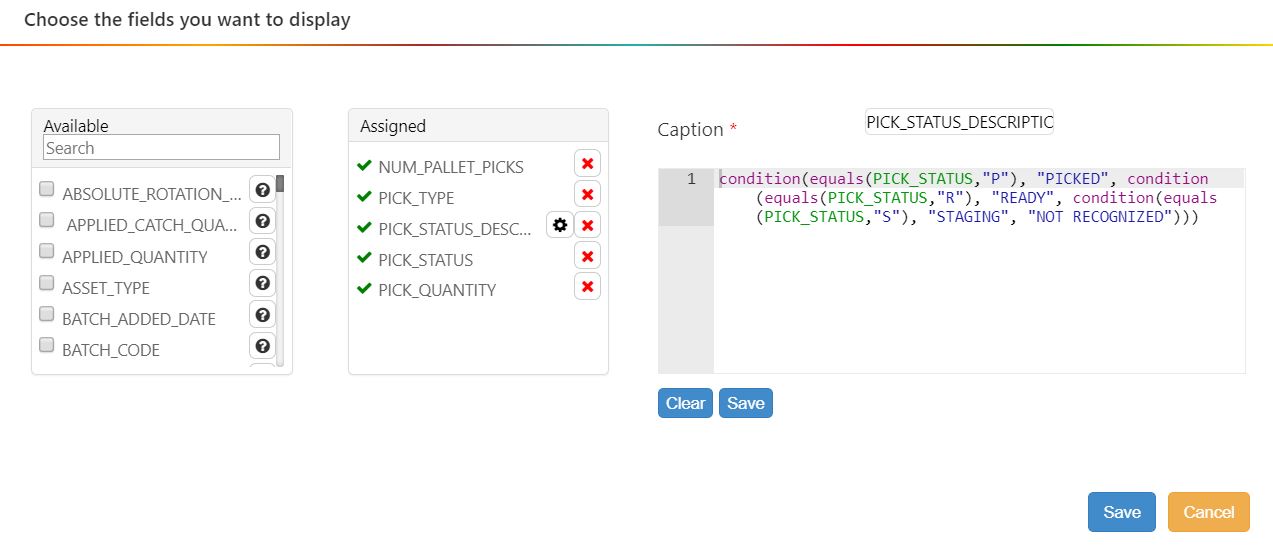
In the example above, PICK_STATUS is first evaluated to see if it’s equal to “P”.
If TRUE, the condition function will return “PICKED”, which will then be shown in PICK_STATUS_DESCRIPTION. Otherwise,
PICK_STATUS will be evaluated to see if it’s “R”.
If TRUE, the condition function will return “READY”. Otherwise,
PICK_STATUS will be evaluated to see if it’s “S”.
If TRUE, the condition function will return “STAGING”. Otherwise, the function returns “NOT RECOGNIZED” because PICK_STATUS must have a value that’s outside what’s expected for PICK_STATUS.
Getting a Count of Records that meet Specified Criteria
In the widget builder, you can set up a widget that shows how many records in the data set meet specified criteria. Do the following:
In the Selecting the Display Fields stage, set up a calculated field that has a condition function that returns a ‘1’ if the record meets specified criteria and ‘0’ otherwise.
Add a Grouping the Data stage.
In the Group Fields column, select the fields by which the rows will be grouped. A group will be created for each set of rows that have values in common across all selected fields. The count of records will be broken down for each group.
Create a calculated field that uses a sum () function to add the values of the condition function field that you set up in the Display Fields stage. This field has a ‘1’ for each record that meets the function’s criteria so adding them all together gives you a count of records that meet the criteria.
Click ‘Save’ and then click ‘Apply’. You see a count of all records in the data set that meet the criteria specified in the condition function broken down by the group you specifed in the Grouping the Data stage.
Example - Count of Records that meet Specified Criteria
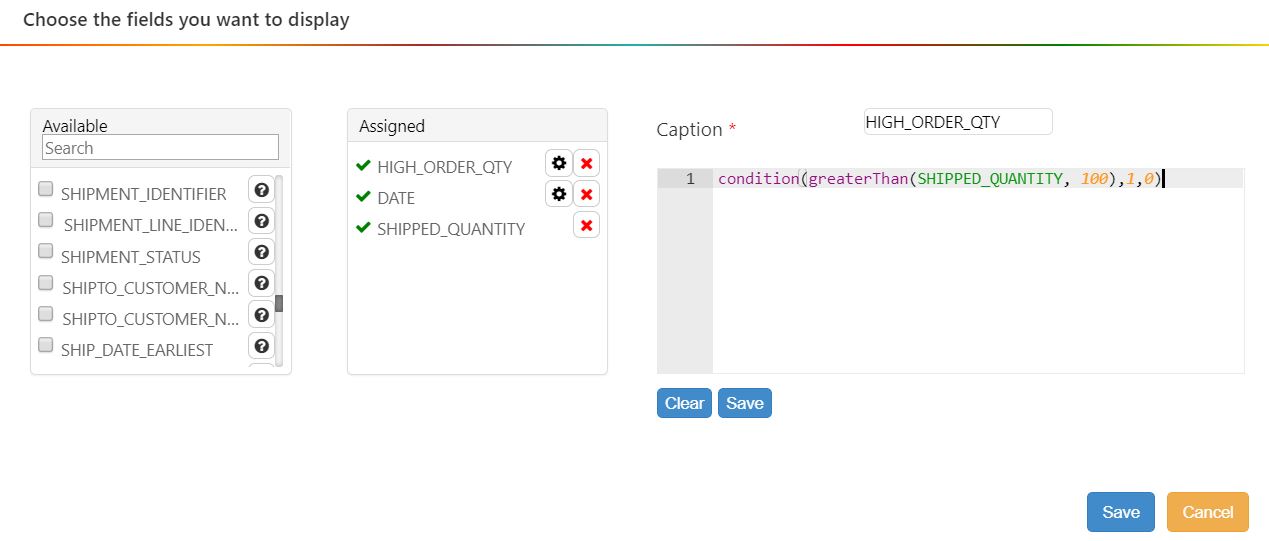
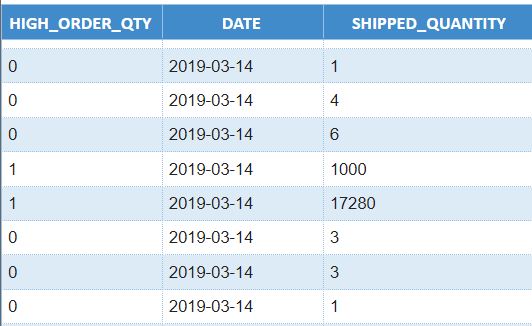
In the following example, we’ll prepare the data for a widget that shows a count of all orders over the past week that had a SHIPPED_QUANTITY of over 100. The count will be broken down by date:
In the Selecting the Display Fields stage, set up a calculated field called ‘HIGH_ORDER_QTY’ that has a condition function that returns a ‘1’ if the order’s SHIPPED_QUANTITY is greater than ‘100’ and ‘0’ otherwise:
condition(greaterThan(SHIPPED_QUANTITY, 100),1,0)
–
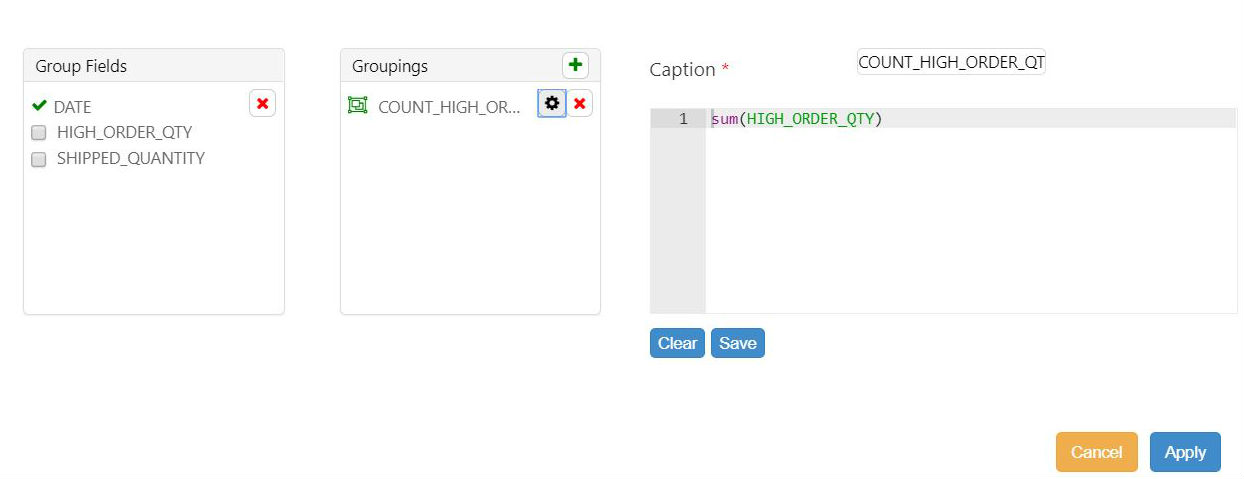
Add a Grouping the Data stage.
In the Group Fields column, click ‘DATE’.
Create a calculated field, COUNT_HIGH_ORDER_QUANTITY, that uses a sum () function to add the values of the HIGH_ORDER_QTY field that you set up in the Display Fields stage. This field has a ‘1’ for each record that meets the function’s criteria so adding them all together gives you a count of records where the SHIPPED_QUANTITY is greater than 100:
sum(HIGH_ORDER_QTY)
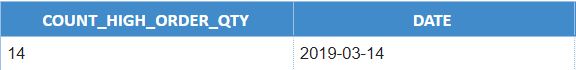
Click ‘Save’ and then click ‘Apply’. You see a count of all records in the data set that meet the criteria specified in the condition function.
Converting Dates into Other Formats
You can have widgets display dates in formats other than UTC. By default, timestamps, which contain date and time of day information for events, are stored and formatted in UTC format. To have a widget display a date in a custom format, in the Selecting the Display Fields stage, set up a calculated field that has the following characteristics:
Has a substring function for each type of date information (e.g., year, month, or day) that you want to extact from the UTC timestamp.
Has a concatenate function within which the substring functions are nested and arranged in the desired order.
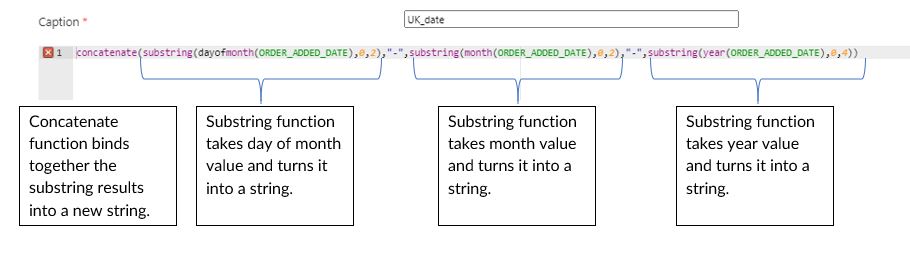
In the example below, we’re using substring functions nested within a concatenate function to create a calculated field that expresses the ORDER_ADDED_DATE field in UK date format (dd-mm-yyyy):
concatenate(substring(dayofmonth(ORDER_ADDED_DATE),0,2),"-",substring(month(ORDER_ADDED_DATE),0,2),"-",substring(year(ORDER_ADDED_DATE),0,4))
Date Sorting in Grid Widgets
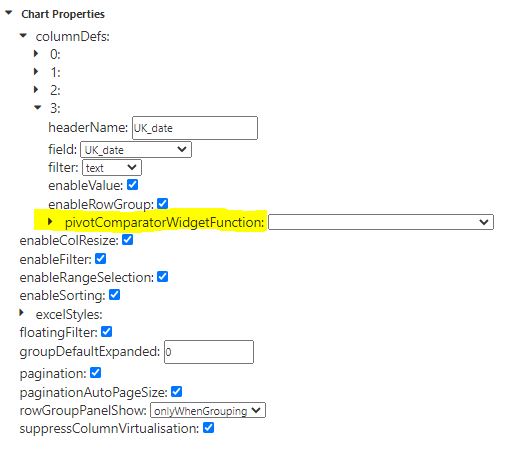
If you’ve re-formatted dates as strings and now the dates aren’t sorted in the proper order in the widget, do the following to enforce the proper sort:
Open the widget’s Chart Properties.
Open the columnDefs properties and then the properties of the date column.
Add a pivotComparatorWidgetFunction.
In the function’s dropdown, select ‘GRID PIVOT SORTATION MM-DD-YYYY’.
Getting a Daily Total of Values
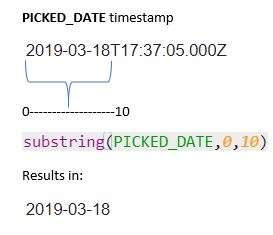
In the widget builder, you can set up a widget that shows you a daily total of values. To get a daily breakdown of a specific field’s number value, you can use the substring() function to create a calculated field that shows just the first ten characters (i.e., the day-month-year portion) of a date’s timestamp, and then group the data by that calculated field:
Go to Administration -> Widget Administration -> Widget Builder, click ‘New’ and set up the Filling in the Basics stage.
In the Filtering Data stage, make sure that one of the display fields is a date field with a timestamp.
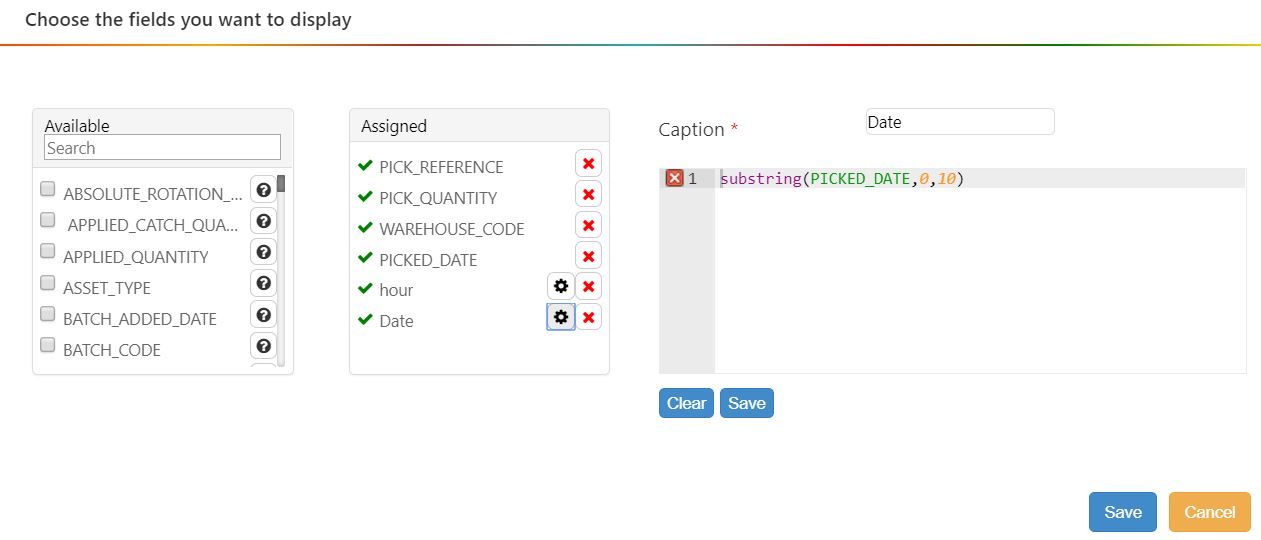
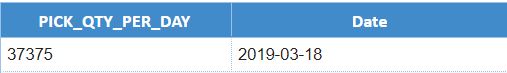
In the Selecting the Display Fields stage, set up a calculated field that uses the substring function to get the first 10 characters of the date field value. In the data set, each record’s calculated field shows the date of the day taken from the record’s timestamp. In the example below, we’re using the substring function to create a calculated field that has only the day, month, and year values of the PICKED_DATE field:
substring(PICKED_DATE,0,10)
In the Grouping the Data stage, group the records by the calculated field showing the day-month-year. Add another calculated field that uses the sum() function to return the sum of all the number values in the specified field. In the example below, we are showing the pick quantity per day:
sum(PICK_QUANTITY)
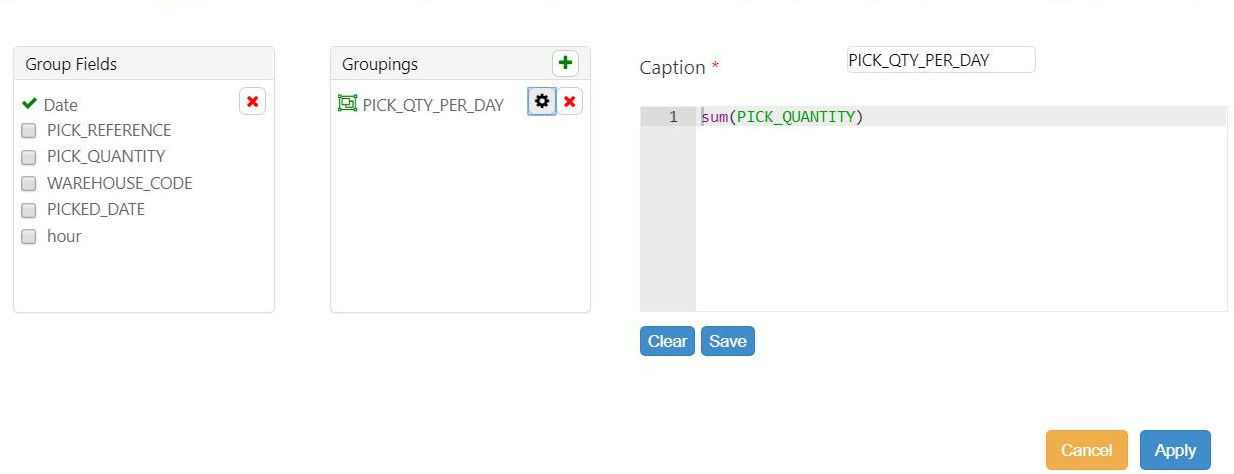
The data set now has a row for each day and each row shows that day’s sum for the specified field.
Getting an Hourly Total of Values
In the widget builder, the hour() function and the sum() function let you set up a widget that shows how a field’s values break down per hour of the day. The hour() function extracts the hours from a date time stamp. Below are the general tips to setting up such a widget:
Go to Administration -> Widget Administration -> Widget Builder, click ‘New’ and set up the Filling in the Basics stage.
In the Filtering Data stage, make sure that one of the display fields is a date field with a timestamp that includes an hour value.
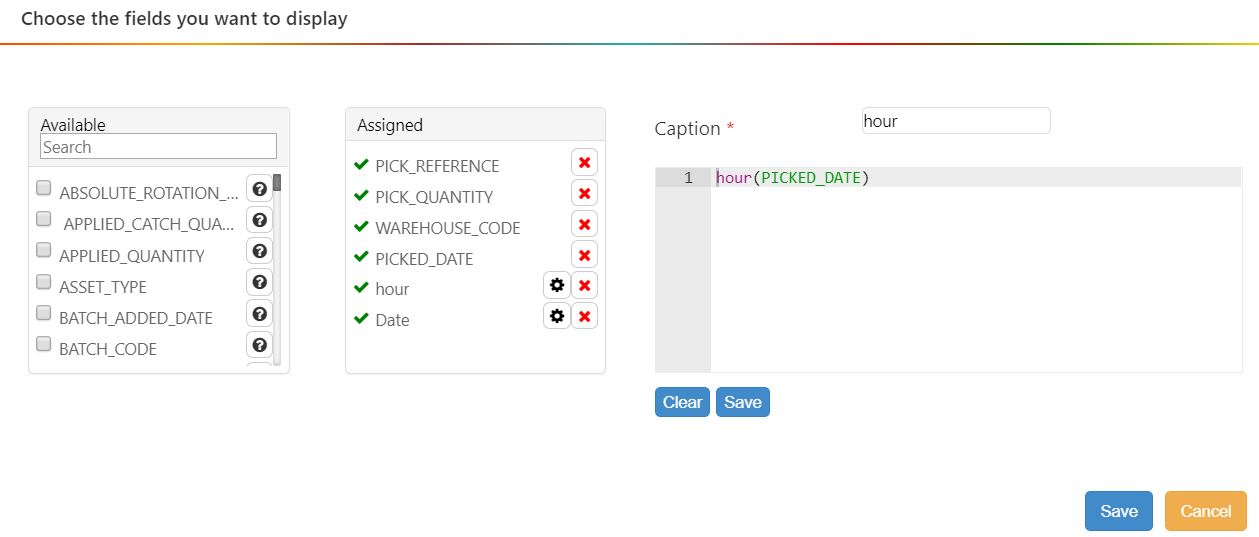
In the Selecting the Display Fields stage, set up a calculated field that uses the hour function to return the hour value of the date field. In the data set, each record’s calculated field shows the hour of the day taken from the record’s timestamp.
hour(PICKED_DATE)
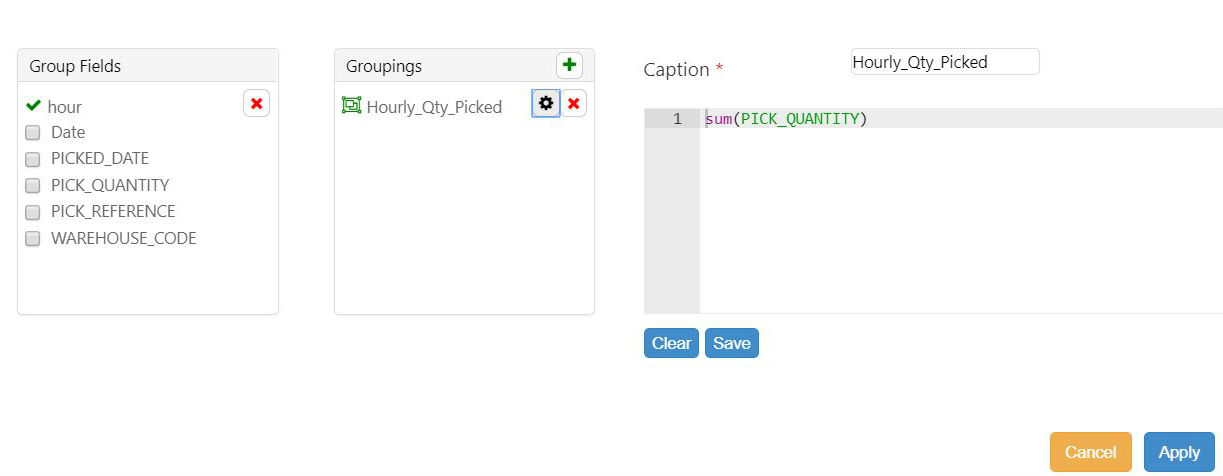
In the Grouping the Data stage, group the records by the calculated field showing the hour. Add another calculated field that uses the sum function to return the sum of all the number values in the specified field.
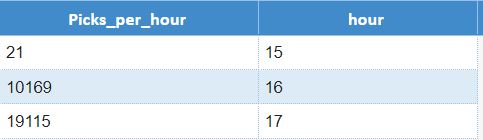
The data set now has a row for each hour of the day and each row shows that hour’s sum for the specified field.
Adding Parameters through the Display Field and Group Stages
In the widget builder, you can use the param() function to add parameters through the code editor on the Display Field and Group stages. The param() function creates a parameter for the widget and specifies its default value:
divide(param(PARAM1,33),77)
In the example above, a parameter, PARAM1, is created. The divide function populates the widget with the value of PARAM1 divided by a constant, 77. PARAM1’s default value is ‘33’, but a user can change PARAM1’s value by opening the widget’s Properties menu. To continue with this example, if you wanted to make both the numerator and the denominator parameters, you could use the following function:
divide(param(PARAM1,33),param(PARAM2,77))
In the example above, both PARAM1 and PARAM2 could be changed through the widget’s Properties menu.
Building Widgets that Refer to the System Date
In the widget builder, you can build widgets that use the system date of the WMS as part of the query that populates the widget. Two functions, sysdate() and sysdatetz(), return the WMS’s current system date or a date in relation to the system date. You can use the output of these functions as arguments for other functions that take date arguments.
Sysdate () function
The sysdate() function returns the system date in Coordinated Universal Time (UTC) i.e., Greenwich Mean Time.
You can use it:
With DATE fields ,
To manipulate data from warehouses in different timezones,
In the filter stage of the widget builder.
Note
Using the sysdate() function in other stages than the filter stage will display the result in Coordinated Universal Time.
Date You Want Returned… |
What you Enter as an Argument… |
Example |
|---|---|---|
Today’s date |
0 |
sysdate(0) |
A date in the past. E.g., yesterday |
The number of days counting back into the past from today’s date expressed as a negative integer. |
sysdate(-1) |
A date in the future. E.g., the day after tomorrow |
The number of days counting ahead into the future from today’s date expressed as a positive integer. |
sysdate(2) |
Example of Sysdate()
You can use the sysdate() function in custom expressions on the Filter stage to use your system’s date as an argument to select data. It must be entered in the format illustrated by the following example:
BATCH_ADDED_DATE>sysdate(-2)
The condition above selects all records whose BATCH_ADDED_DATE value is within the past two days counting back from today’s date.
Sysdatetz () function
The sysdatetz() function returns the system date in a specified time zone.
You can use it:
With DATE_LOCAL fields,
To manipulate data from facilities in the same timezone,
To display data according to a specified timezone,
In the display fields, group, or sort stages of the widget builder.
 Using the sysdatetz() function in the filter stage will return incorrect values if your warehouses are in different timezones.
Date You Want Returned… |
What you enter as an argument… |
Example |
|---|---|---|
Today’s Date |
0 and the time zone |
sysdatetz(0, America/New_York) |
A date in the past. E.g., yesterday |
The number of days counting back into the past from today’s date expressed as a negative integer and the time zone. |
sysdatetz(-1, America/New_York) |
A date in the future. E.g., the day after tomorrow |
The number of days counting ahead into the future from today’s date expressed as a positive integer and the time zone. |
sysdatetz(2, America/New_York) |
The list of time zones that can be supplied as arguments for sysdatetz() come from the tz database, which is described on the following webpage: https://en.wikipedia.org/wiki/List_of_tz_database_time_zones
Examples of Sysdatetz()
The dateDifferenceInMs() function below would return the time difference in milliseconds between the REPORT_LOCAL_DATE of warehouses in the same timezone and today’s date.
dateDifferenceInMs(sysdatetz((0),AMERICA_NY), REPORT_LOCAL_DATE)
Manipulating Multi-Steps Activities In A Widget
You can set up a labor module widget that calculates only the unique values in multi-step activity and ignores the rows containing repeated values.
Each step of a multi-step activity has information about the whole activity. In the following example, both steps of the activity number 43 and 94 display the UNMEASURE_TIME_SECONDS for the entire activity:
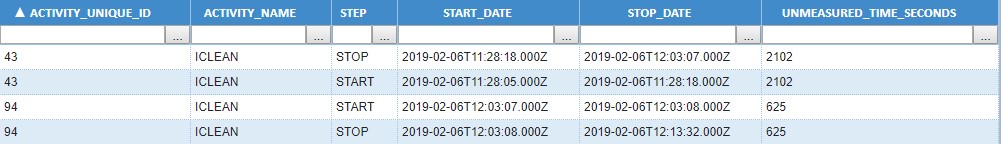
Building a widget that sums the UNMEASURED_TIME_SECONDS for this data sample will result in inflated values, as the measure for the whole activity is added twice. The total UNMEASURE_TIME_SECONDS for the ICLEAN activity returns 5454 seconds instead of the expected 2727 seconds.
To prevent repeated values from being added twice, a grouping stage must be added after the filter stage and before the grouping stage in which the sum function is used. Before you set up a grouping stage, make sure that you know the unique value that identifies the activity.
In the widget builder, using non-guided mode, add a grouping stage and select the activity’s unique identifier as well as the fields you wish to display in your widget.
The example below shows the same data sample after a grouping stage was added to eliminate duplicate values:
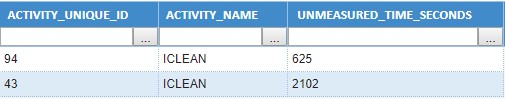
Add a second grouping stage that uses the aggregate function. The total UNMEASURE_TIME_SECONDS for the ICLEAN activity now returns the expected value of 2727 seconds.
Selecting Records based on Patterns in String Values
The regexp() function lets you create a widget that selects records that have a string of characters that match a specified ‘regular expression’ or ‘regex’ pattern:
FIELD_NAME = regexp(expression(REGEX_PATTERN),options(REGEX_FUNCTION_OPTIONS))
For each record, the regexp() function evaluates the specified field’s value (a.k.a. the input string) and selects the record if the value matches the regex pattern. You can also specify an options argument that provides options about how an input string is evaluated.
Example of Regexp() function:
JC_DESCRIPTION=regexp(expression(^LOAD\*),options(i))
The above function selects all records where JC_DESCRIPTION starts with ‘LOAD’ and doesn’t consider the case of the letters. The function’s case insensitivity is set by the i options() argument.
The regexp() function can be used when adding a custom expression at the Filter stage Filter stage.
Note
Overview of Regex Patterns
A Regex pattern comprises a string and special characters that specify a pattern of characters and how you want input strings to be evaluated. At its simplest, a Regex pattern is a string. Records that have values that contain that string are selected. Unless specified otherwise, the search will be case sensitive. I.e., ‘a’ and ‘A’ are considered to be separate characters.
Regex Pattern |
Matching Values |
|---|---|
abc |
abcdefg |
234 |
123456 |
Quantifiers
In a Regex pattern, a quantifier lets you specify how many instances of a character in the input string constitute a match. Put a quantifier after the character in a Regex pattern:
Quantifier |
Matching Values… |
|---|---|
* |
Have this character zero or more times. |
+ |
Have this character one or more times. |
? |
Have this character only one time or not at all. |
Quantifier Examples
Regex Pattern |
Example Matching Values |
|---|---|
23* 4 |
1245, 12345, 123345, 1233345 |
23+4 |
12345, 123345, 1233345 |
23?4 |
1245, 12345 |
Special Characters
A Regex pattern can have ‘special characters’ that each represent a set of matchable characters in the input string.
Special Character |
Represents… |
|---|---|
|
Any single character. |
\n |
A new line character. |
\t |
A tab. |
\d |
A digit [0-9]. |
\D |
A non-digit. |
\w |
An alphanumeric character. |
\W |
A non-alphanumeric character. |
\s |
A whitespace character. |
\S |
A non-whitespace character. |
Special Character Examples
Regex Pattern |
Example Matching Values |
|---|---|
1.3 |
123, 1z3, 1A3 |
1.* 3 |
13, 123, 1abcdefg3 |
\d\d |
01, 03, 88 |
\w+@\w + |
a@a , email@domain.com |
Character Classes
A character class is a set of characters between square brackets. Like special characters, a character class in a Regex pattern represents a set of matchable characters in the input string.
Character Class |
Represents… |
|---|---|
[abc] |
Either ‘a’ or ‘b’ or ‘c’. |
[^abc] |
Any character other than ‘a’, ‘b’, or ‘c’. |
[a-z] |
Any character between ‘a’ and ‘z’. |
Anchors
Anchors let you specify whether the beginning or the end of an input string is evaluated against the Regex pattern.
Anchor |
The Input String is a Match… |
|---|---|
^ |
When the start of the string matches the Regex pattern. |
$ |
When the end of the string matches the Regex pattern. |
Anchor Examples
Regex Pattern |
Example Matching Values |
Example Non-Matching Values |
|---|---|---|
^1.*3$ |
13, 123, 1abcdefg3 |
x13, 123x, x1abcdefg3x |
^\d\d |
01abc |
a01abc |
\d\d$ |
xyz01 |
xyz01x |
Assertions
Assertion |
Description |
Example |
Input string will be a match if it… |
|---|---|---|---|
?= |
Lookahead |
a(?=b) |
Has an ‘a’ followed by a ‘b’. |
?! |
Negative Lookahead |
a(?!b) |
Has an ‘a’ not followed by a ‘b’. |
Example of Negative Lookahead
The negative lookahead assertion can be the best choice if you want to look at all the records in a set but exclude some whose values match a certain pattern. For example, the following regexp() retrieves all order records except those where the CUSTOMER_NAME starts with ‘AMAZON’:
CUSTOMER_NAME=regexp(expression(^(?!AMAZON)?),options(i))
Regex Function Options
The regexp() function can also pass an options() argument, which supplements the usual Regex pattern options and gives you greater control over how an input string is evaluated. To not use any of these options, pass a blank options() inside regexp():
JC_DESCRIPTION=regexp(expression(^LOAD?),options())
Option |
Description |
|---|---|
i |
Insensitivity to case when matching letters. E.g., No distinction made between ‘A’ and ‘a’, which would usually be treated as different characters. |
m |
When evaluating strings with multiline values, anchors (i.e. ^ for the start, $ for the end) will match at the beginning or end of each line . Without this option, these anchors match at the beginning or end of the entire string. |
x |
Ignore all white space characters in a pattern unless escaped (/) or included in a character class. Also ignore all hash/pound characters (#) and all characters enclosed between them, which lets you include comments in complicated patterns. |
s |
Let the dot character (.) match all characters including newline characters. |
Subtracting Weekends From Date Range Calculation
In the Display Fields stage, to create a calculated field that subtracts weekends from a date range calculation, use the below expression. In this example, we calculate the age of an open order between Sysdate(0) (i.e., today) and the ORDER_ADDED_DATE. You can replace these date fields with the ones you’re using.
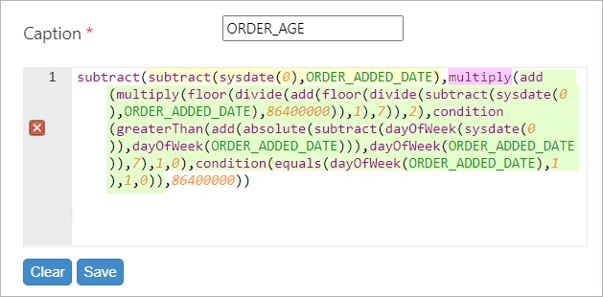
subtract(subtract(sysdate(0),ORDER_ADDED_DATE),multiply(add(multiply(floor(divide(add(floor(divide(subtract
    (sysdate(0),ORDER_ADDED_DATE),86400000)),1),7)),2),condition(greaterThan(add(absolute(subtract(dayOfWeek(sysdate(0))
    ,dayOfWeek(ORDER_ADDED_DATE))),dayOfWeek(ORDER_ADDED_DATE)),7),1,0),condition(equals(dayOfWeek(ORDER_ADDED_DATE),1),1,0)
    ),86400000))
This expression returns a value in milliseconds. You can then convert this expression to hours, days, weeks, etc., by nesting it within a divide() function.
You can then continue reading for a detailed explanation of the following:
Explanation of Expression that Subtracts Weekend Days from a Date Range Calculation
The expression subtracts the number of weekend days (in green) from the total date range (in yellow). The multiply() function (in pink) is used to convert the number of weekend days into milliseconds.
Explanation of Expression that Calculates Weekend Days
The expression to calculate the number of weekend days is the following:
add(multiply(floor(divide(add(floor(divide(subtract(sysdate(0),ORDER_ADDED_DATE),86400000)),1),7)),2),condition
    (greaterThan(add(absolute(subtract(dayOfWeek(sysdate(0)),dayOfWeek(ORDER_ADDED_DATE))),dayOfWeek(ORDER_ADDED_DATE)),7),1,0),
    condition(equals(dayOfWeek(ORDER_ADDED_DATE),1),1,0))
To explain this expression, we will break it down into three major steps:
Find the number of full weeks between the two dates.
Find the number of full days between the two dates.
Calculate the number of weekends based on:
The starting day of the week;
Ending day of the week;
And the number of weeks between the two dates.
Each of the above steps are explained in more detail below while keeping the same example in mind.
1. Find the number of full weeks between the two dates.
Get the number of days between the starting date and ending date:
add(floor(divide(subtract(sysdate(0), ORDER_ADDED_DATE),86400000)),1)Take away points from this expression:
The subtract() function is used to calculate the date rage between the two dates.
The divide() function is used to convert this date range into days.
The floor() function is used to get the full number of days between the two dates.
The add() function is used to add one more day: if you are on the same day, you are still within one day difference between the two dates.
Take the value from above, and get the number of full weeks between the two dates. For simplicity, the above expression is referred as DAYS_BETWEEN.
floor(divide(DAYS_BETWEEN,7))Take away points from this expression:
The divide() function is used to divide the number of days by 7 to get the number of weeks.
The floor() function returns the larget integer less than or equal to the result.
2. Find the number of full days between the two dates.
Get the day of the week for the two dates using the dayOfWeek() function:
The starting day of the week:
dayOfWeek(ORDER_ADDED_DATE)The ending day of the week:
dayOfWeek(sysdate(0))Get the remaining full days based on starting and ending days of the week calculated in the preivous step. For simplicity, these dates will be referred as START_DOW and END_DOW.
add(absolute(subtract(END_DOW,START_DOW),START_DOW))Take away points from this expression:
In summary, this expression allows us to determine, based on the starting and ending days of the week, how many weekdays and weekends we can calculate in the date range.
The subtract() function is used to calculate the difference between the ending and starting days of the week.
The absolute() function is used to get the absolute value of the difference between the ending and starting days of the week.
The add() function is used to add up the absolute value and the starting day of the week
3. Calculate the number of weekends between the two dates.
By combining the above expressions, we can formulate the below expression to calculate the number of weekends between the dates. For simplicity, the expressions covered in the previous steps will be referred to as the following:
Expression from step 1.2: WEEKS_BETWEEN
Expression from step 2.1: START_DOW
Expression from step 2.2: REMAINING_DAYS_BETWEEN
Add(multiply(WEEKS_BETWEEN,2),condition(greaterThan(REMANING_DAYS_BETWEEN,7),1,0),condition(equals(START_DOW,1),1,0))Take away points from the overall expression:
The multiply() function is used to multiply the number of weeks by 2, since a full week contains two weekend days.
The subexpression “condition(greaterThan(REMANING_DAYS_BETWEEN,7),1,0)” is used so that, if in addition to the full weeks, you are starting on Friday, Saturday, or Sunday, add 1 to account for starting from the day that falls into a weekend date.
The subexpression “condition(equals(START_DOW,1),1,0))” is used so that, if you’re starting on a Sunday, add 1 to account for the weekend.
Both the condition() functions are used for the following logic:
If the REMAINING_WEEK_DAYS between the two dates is greater than 7, the dates overlap through a weekend and therefore contain two weekend days.
If the REMAINING_WEEK_DAYS between the two dates is exactly 7, there is one weekend day between Monday and Saturday, or two weekend days if the ending day of the week is Sunday.
If the REMAINING_WEEK_DAYS between the two dates is less than 7, there are no weekend days between Monday and Saturday, or there is one weekend day if the ending day of the week is Sunday.
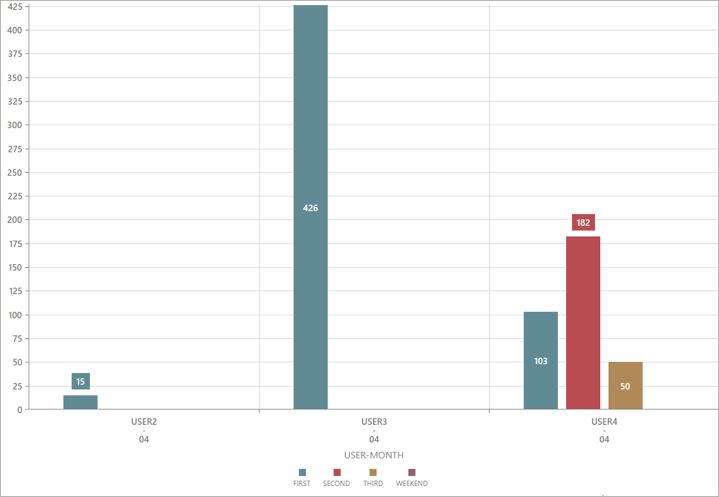
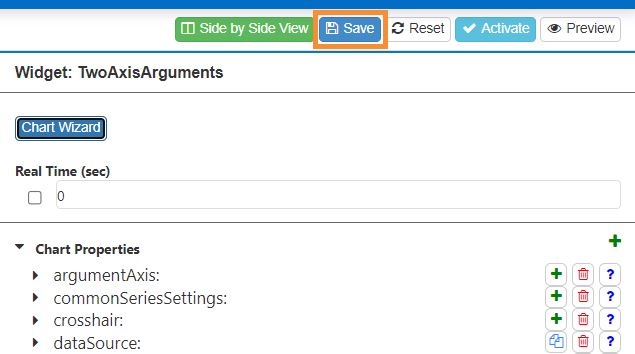
Setting Up a Widget with Two X Axis Arguments
You can set up a bar chart widget with two X axis arguments. In the below example, we are combining both the username and the month (returned as a number).
Whether you need to create or edit a widget, follow these steps:
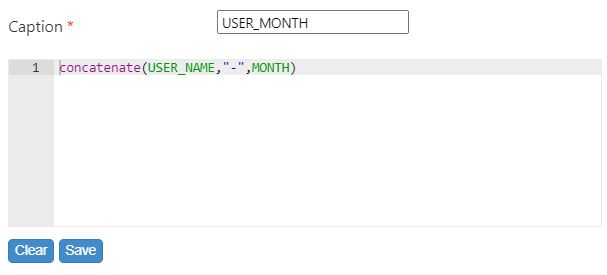
In the Display Fields stage, add a calculated field that uses the concatenate() function to combine both fields you want to use as X axis arguments. In this example, we are combining the fields USER_NAME and the MONTH, and separating them with a “-“
concatenate(USER_NAME,"-",MONTH)
Do the steps according to your situation:
Finish going through the rest of the Widget Buidler stages.
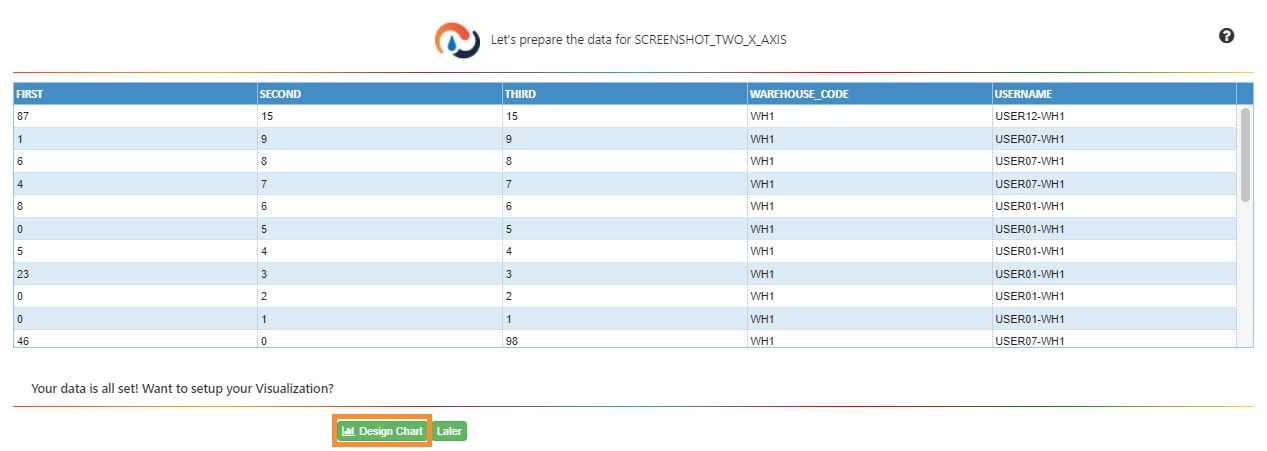
Select ‘Design Chart’. You are prompted to choose a chart.
Set up the desired chart with the calculated field as the X axis, and click ‘Apply’. You are brought to the Widget Builder screen, and have set up a widget with two X axis arguments.
To save the changes made to the Display Fields stage, click ‘Save’. You’re brought back to the Widget Builder screen.
Replace the current parameter used as the X axis with the calculated field. To do so, follow these steps:
Select ‘Design Chart’. The Chart Properties panel appears on the right.
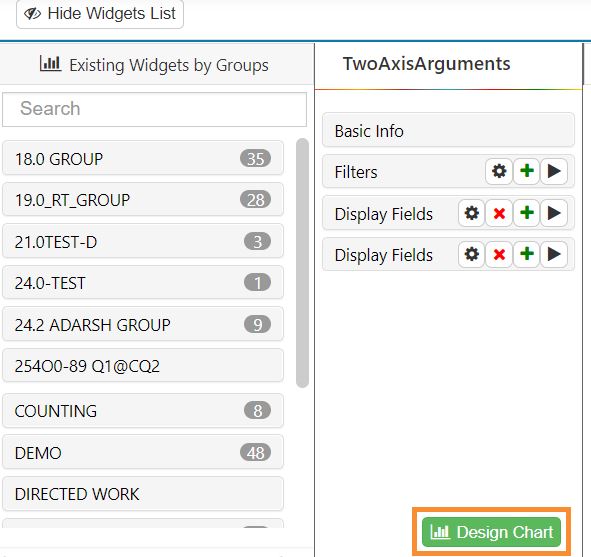
From the Chart Properties panel, expand the ‘commonSeriesSettings’ property.
Next to the ‘argumentField’ property, from the dropdown, select the calculated field.
Click ‘Save’. You have set up a widget with two X axis arguments.
Note
On the X axis, the labels combine both parameters into one single line. If you wish to separate the parameters into different lines like the example shown above, see the next section Formatting X Axis Argument Labels Into Multiple Lines.
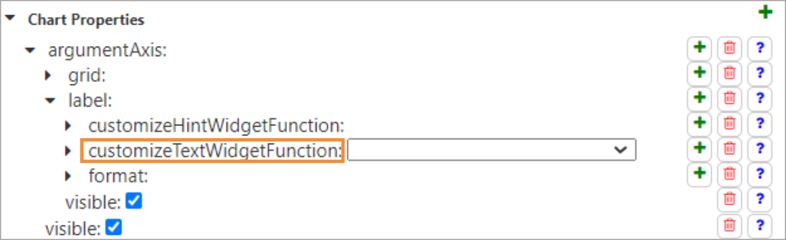
Formatting X Axis Argument Labels Into Multiple Lines
Follow these steps:
In the Chart Properties panel, ensure the ‘customizeTextWidgetFunction’ property is added. If not, add it manually.
Next to ‘customizeTextWidgetFunction’, from the dropdown, select ADD NEW LINE SEPARATOR.
Note
This function is not available by default for security reasons. If it’s not available in your list, contact the Rebus Support team to have it added to your account.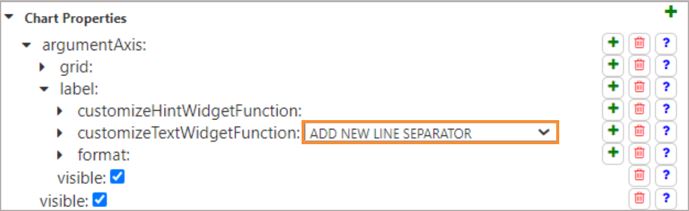
To save the new chart properties, click ‘Save’. You have formatted the labels to separate them into different lines.