Getting Around Rebus#
Parts of Rebus#
Rebus comprises the following parts:
Part |
Description |
|---|---|
Home Screen |
The first screen you see after logging in. Here you can see your favorite widgets, write and share notes, see alert notifications, and access your customized menu. For more information, see Favorite Widgets |
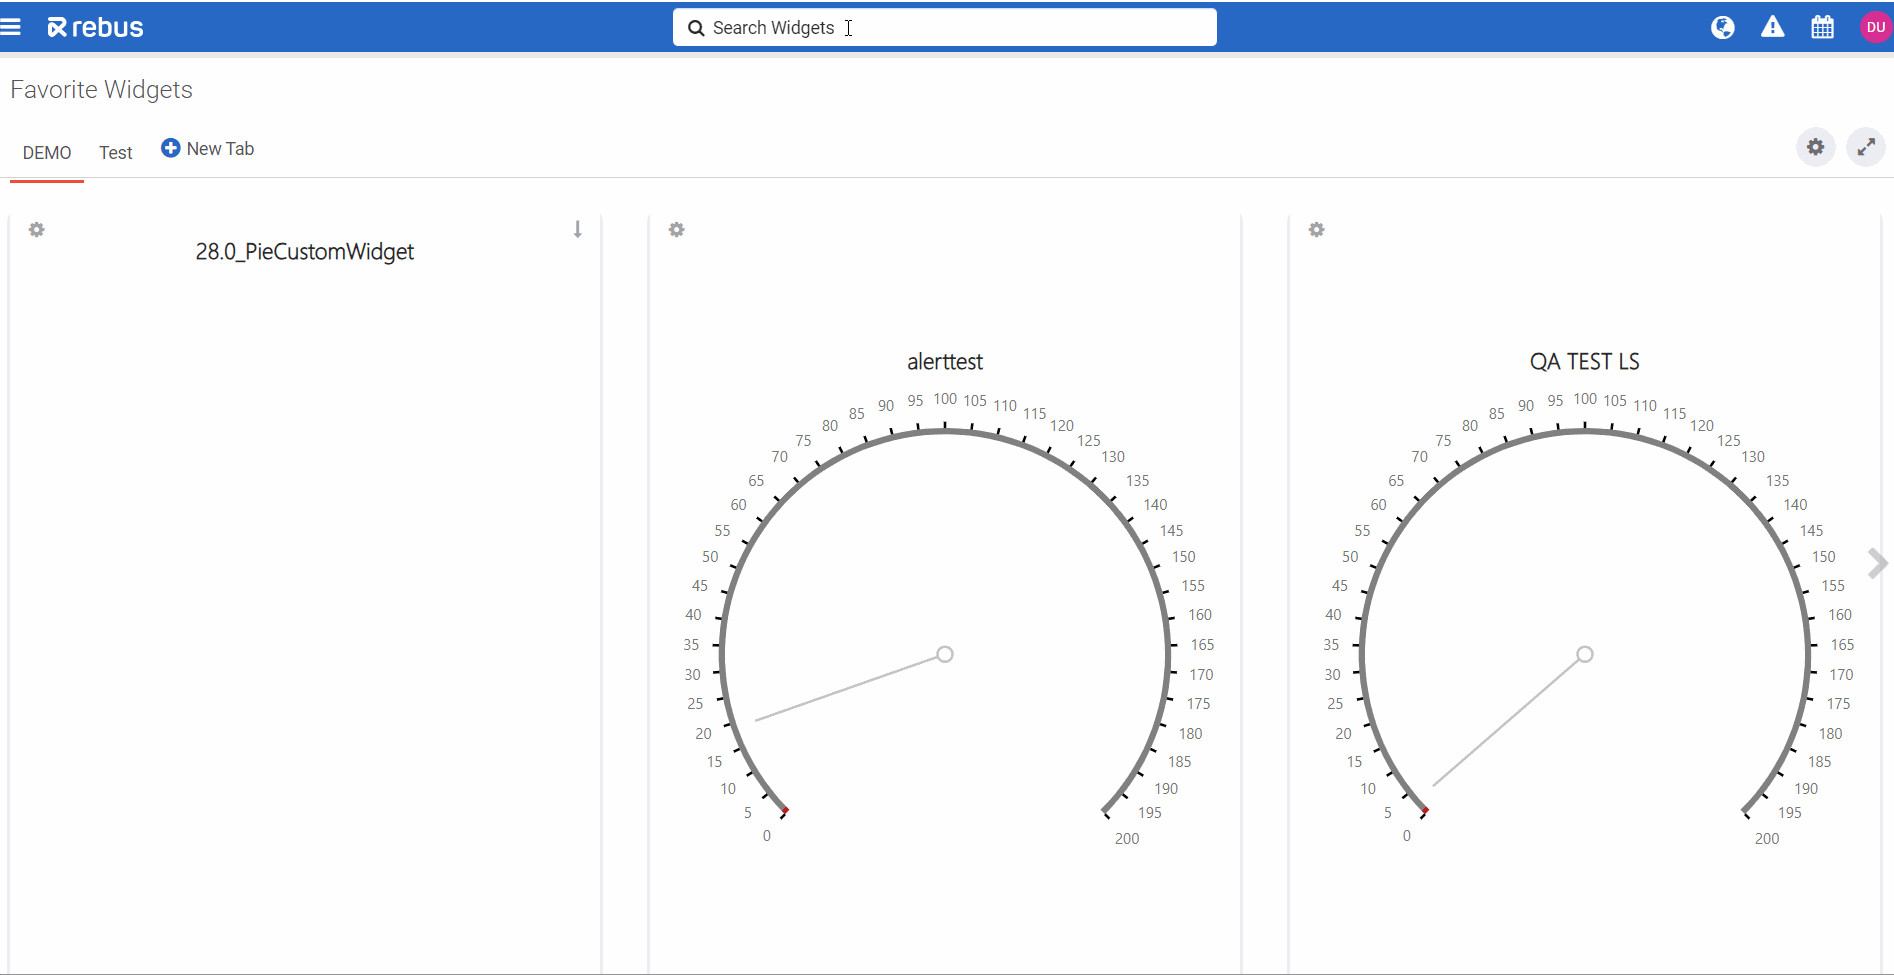
Dashboards |
A dashboard is a collection of widgets with user-defined parameters. You can create and organize dashboards to give you easy access to important information. For more information, see Planning Dashboards and Managing Dashboards. |
Admin Tools |
NOTE - To access these tools, your My Account screen needs to be set up for access. Through these tools, you can access screens pertaining to the Labor module, widgets, and users. |
Widgets |
Dynamic visualization of data with user-defined parameters. Rebus has a default set of widgets, but you can build your own custom widgets. In Rebus, you can set up a widget that uses a query to pull data from a data collection and presents it in a graphical format. Widgets are added to dashboards. |
Rebus AI |
A chat bubble appears in the lower right-hand corner of every Rebus page. It opens a chat window where you can type questions. The Rebus AI Chatbot responds with an answer based on Rebus user documentation and clickable links to relevant sections in the Rebus Help Center when applicable. |
Accessing Dashboards and the Home Screen through the Toolbar and Menu#
Access your dashboards through the Menu in the left panel of the Home screen.
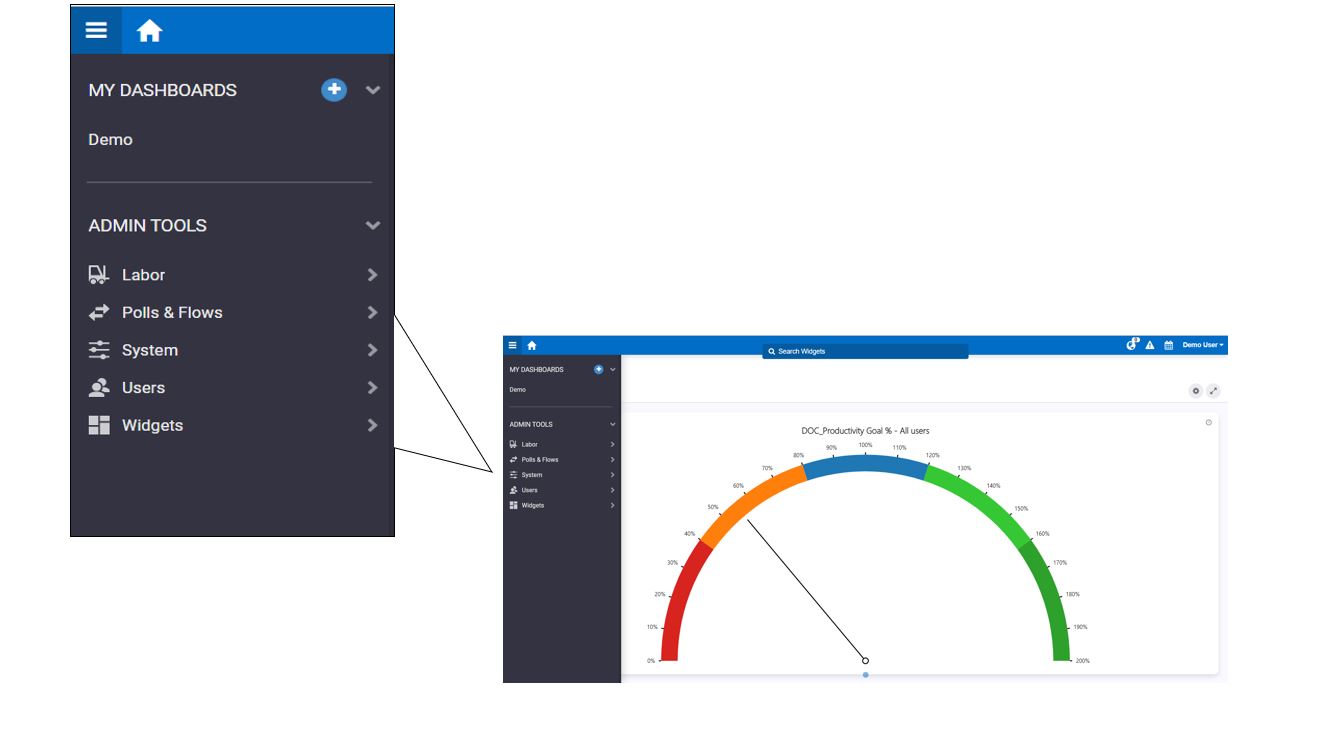
To get back to the Home screen, click the Home Screen icon  in the upper left.
You can access the Menu from any screen by clicking the  button in the top left.
Searching for Widgets brings you to a Dashboard#
For quick access to a widget that’s already been set up on one of your dashboards:
In the Widget Search in the toolbar, enter your search term. A dropdown appears that has widgets whose name matches your search term.
From the dropdown, select the widget you want. You are taken to the dashboard that has the selected widget.
Rebus AI#
The Rebus AI button appears in the bottom-right corner of every screen except the Login screen. Clicking it opens the AI panel on the right side of the screen. You can temporarily hide the button by clicking the small “X” next to it. It reappears when you refresh or return to the page.
The Chat tab opens by default when you launch the panel. The Rebus AI Chatbot responds with an answer based on Rebus user documentation and clickable links to relevant sections in the Rebus Help Center when applicable. You can ask questions about what functions are available on a screen, how to perform certain procedures, or to define certain concepts.
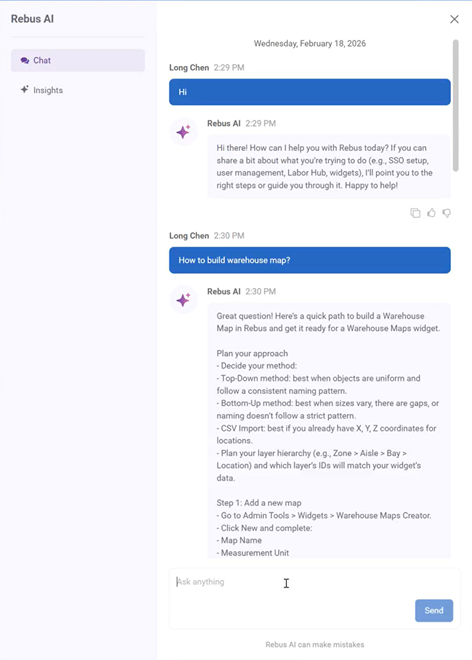
The chat interface includes predefined suggestions in the empty state. A Suggestions section provides quick start prompts like:
How do I manage my organization details?
Give me best practices for widget building.
Selecting a suggestion automatically sends it as a query.
You can view a history of your past Chatbot conversations. Previously submitted queries are stored and displayed in a historical list under the Chat tab. Clicking a history item will automatically resend that question to the chatbot.