Rebus AI Tools#
You can use different AI tools in Rebus to increase your efficiency and reduce your manual workload. In addition to the Rebus AI Chatbot, there are several more advanced tools available to you, including
AI Dashboard Insights
Intra-day AI Agent
AI Trend Forecasting
You can disable Rebus AI tools from dashboards without losing core platform functionality. Go to the Admin Tools -> System -> Organization Admin screen -> Organization Details tab. Click the ‘Enable AI Dashboard Insights’ toggle so that it’s turned off. The Rebus AI panel is removed from your environment’s dashboards.
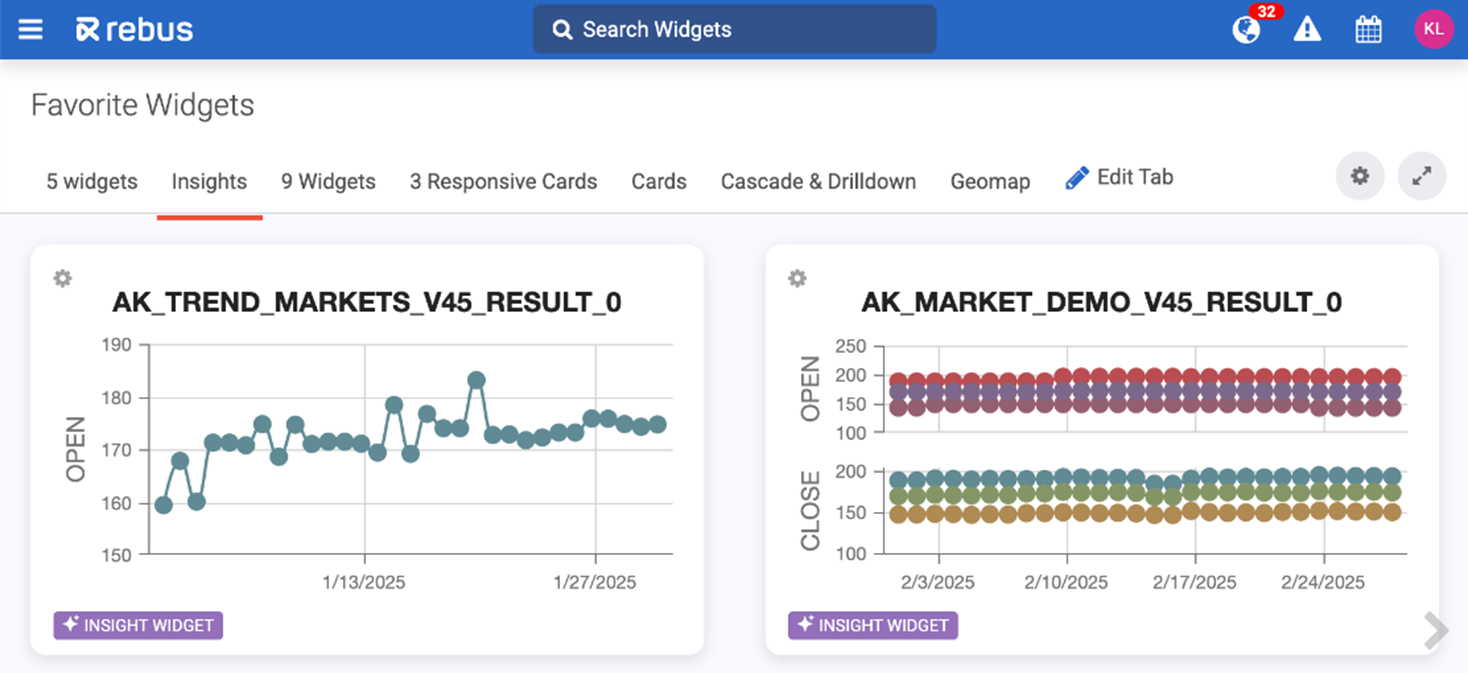
Using AI Dashboard Insights#
You can use AI to analyze widgets and give you insights into the information your dashboard contains. This helps you better understand your data by automatically identifying trends, patterns, and outliers across your dashboard widgets, which then helps you make smarter and more informed decisions
Pre-requisites#
Rebus AI Dashboard Insights uses the widget Name and Description to help generate information. It’s important that your widget details accurately reflect the data in your widget. You should:
Be clear. Instead of having a title that reads “P-w12,” use “Pallets in Warehouse 12”.
Be precise. Instead of having a title of “Sales” and a description that reads “Monthly”, use the title of “Monthly Sales- North America” and a description that reads “Total gross revenue from all product lines in North America, grouped by month.”
Steps#
Click on the AI Insights button on the top left of your dashboard.
The AI Dashboard Insights panel opens.
Click Ask Rebus AI.
The system will provide a widget summary that explains data trends and highlights any anomalies.
You can also keep track of previously generated AI insights by clicking the dropdown at the top of the insights panel. To get more information on the dashboard widgets that were analyzed, click the information icon at the end of your generated insight. This info includes names and descriptions of all analyzed widgets.
Intra-Day AI Agent#
Rebus’s Intra-Day AI Agent is a feature in Rebus AI that helps you manage outbound warehouse work more effectively throughout the day, directly from your dashboard. This tool helps you:
See which orders are ahead of or behind schedule
Identify the most urgent orders, and
Get suggestions on moving associates to where they’re needed most
Instead of manually reviewing orders, deadlines, and staff availability, the Intra-Day AI Agent analyzes your dashboard data for you and provides clear, simple recommendations.
Concepts#
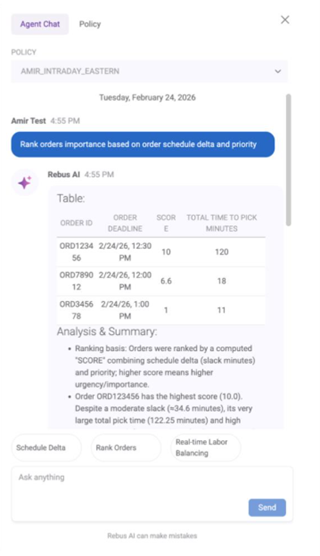
You can get to the Intra-Day tab from the Rebus AI panel. From here, you can configure your own Intra-Day Policies, which tell the agent how to analyze a dashboard’s data. For example, you can ask questions pertaining to 3 main subjects:
“Which orders are behind schedule?” The system calculates how much “slack time” each order has, meaning whether it’s ahead of schedule or falling behind. You’ll see results like: “Order 200 is 50 minutes behind schedule and needs attention.”
“What are my most critical orders right now?” The system can automatically prioritize orders based on slack time and optional weighting that you can configure. You’ll see results like: “Order 200 is the most critical due to negative slack and an approaching cutoff.”
“Should I move anyone to a different order?” If an order is falling behind, the assistant can suggest moving an available associate to help. You’ll see results like: “Move John Smith to Order 200 since it is most critical and John Smith is available.”
The assistant will review your data and respond with a clear explanation and recommendation, and a table showing the details behind the recommendation.
Policies#
A policy is a configuration that defines how the Intra-day Agent analyzes warehouse operations. Policies are personal to each user and are tied to the dashboard where they are created.
The Agent relies on two types of widgets: The Outbound Widget and the Active Associates Widget, which provide data on warehouse order progress and warehouse workers’ current assignments respectively. These widgets only need to be set as Active in Widget Builder and do not need to be present on your dashboard.
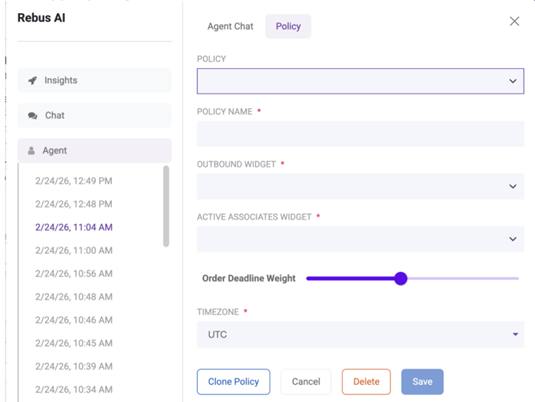
Within the policy, you can also define Order Deadline Weight, which tells the Intra-day Agent how important the order deadline should be when evaluating which orders need attention first. It works on a scale from 1-10, with 10 representing the highest level of importance.
Steps#
Create at least 2 widgets (Outbound and Active Associates). Only these two widgets are supported for the Intra-Day AI Agent, and they must contain the required fields listed below.
Widget |
Parameters |
|---|---|
OUTBOUND WIDGET |
ORDER_ID – Identifier for the order |
ACTIVE ASSOCIATES WIDGET |
ASSOCIATE_ID – Identifier for an Associate |
Click the Rebus AI button in the bottom-right corner while on your dashboard. Navigate to the Agent tab.
Go to Policy and select Create New Policy. A policy is a configuration that defines how the Intraday Agent analyzes warehouse operations, and it relies on the data from your Outbound and Active Associates widgets. Fill out the form and select your pre-configured widgets. Save the policy.
Navigate to the Agent Chat, select the policy you want to use, and run a prompt. You can choose between a custom prompt or one of our preset options. Your prompt must relate to one of the following subjects: Order scheduling, Ranking order urgency, Moving around associates
The AI Agent will produce a data table that includes data relevant to your prompt, as well as an explanation of that data.
You can create multiple policies, clone existing policies, and continue conversations from previous sessions.
AI Trend Forecasting#
The AI Trend Forecasting module is an optional service designed to forecast labor costs using machine learning. This module enables you to predict future data trends based on historical data, allowing for better labor cost planning and tracking.
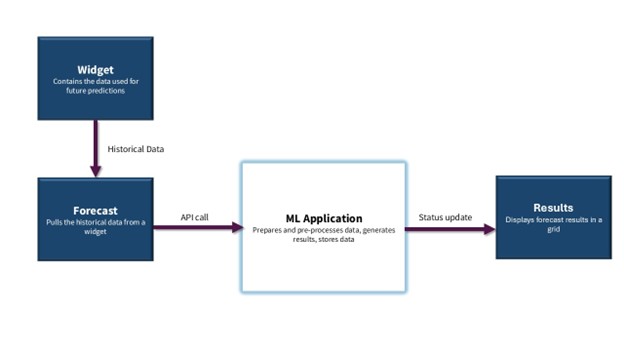
The process starts with the creation of a forecast, which is based on historical widget data. The module then uses machine learning algorithms to generate predictions, which are displayed at the end of the process. These algorithms are entirely date-based, meaning that they rely on past performance to predict future performance.
They also take into consideration both country and time-zone, which means holidays and regular work weeks are factored into calculations. This process does not yet accommodate external factors such as major changes in a warehouse’s structure or labor force.
Concepts#
Term |
Definition |
|---|---|
Forecast |
A tool used to analyze historical data through machine learning algorithms. |
Pipeline ID |
A unique identifier assigned to each forecast run. |
ML |
Machine Learning |
How Trend Forecasting Works#
A forecast is run, which triggers an API request to the ML application.
The ML application processes the request by preparing and pre-processing data, generating results, and storing them in the database.
The forecast’s status is updated at each step, keeping you informed about the progress.
Finally, the results are generated and include:
The Execution date & ID
The Pipeline ID
The forecasted results of the data you want predicted.
How ML Calculates Predicted Fields#
When creating a forecast, you select a widget as the basis of the forecast’s configuration. The widget must have at least one date field and one numerical field, and ideally at least a year of historical data. The ML model will use this data to predict future labor costs.
You have the option of creating a General or an Advanced set-up. The Advanced set-up allows you to filter the widget data you want included in the forecast and use a training model to help the ML application’s accuracy.
After a forecast is run, an API request is sent to a cloud-run instance where the ML application is located. Here it prepares data, completes pre-processing for ML forecasting, generates results, and stores them in the database.
Finally, the forecast results are shown as a grid.
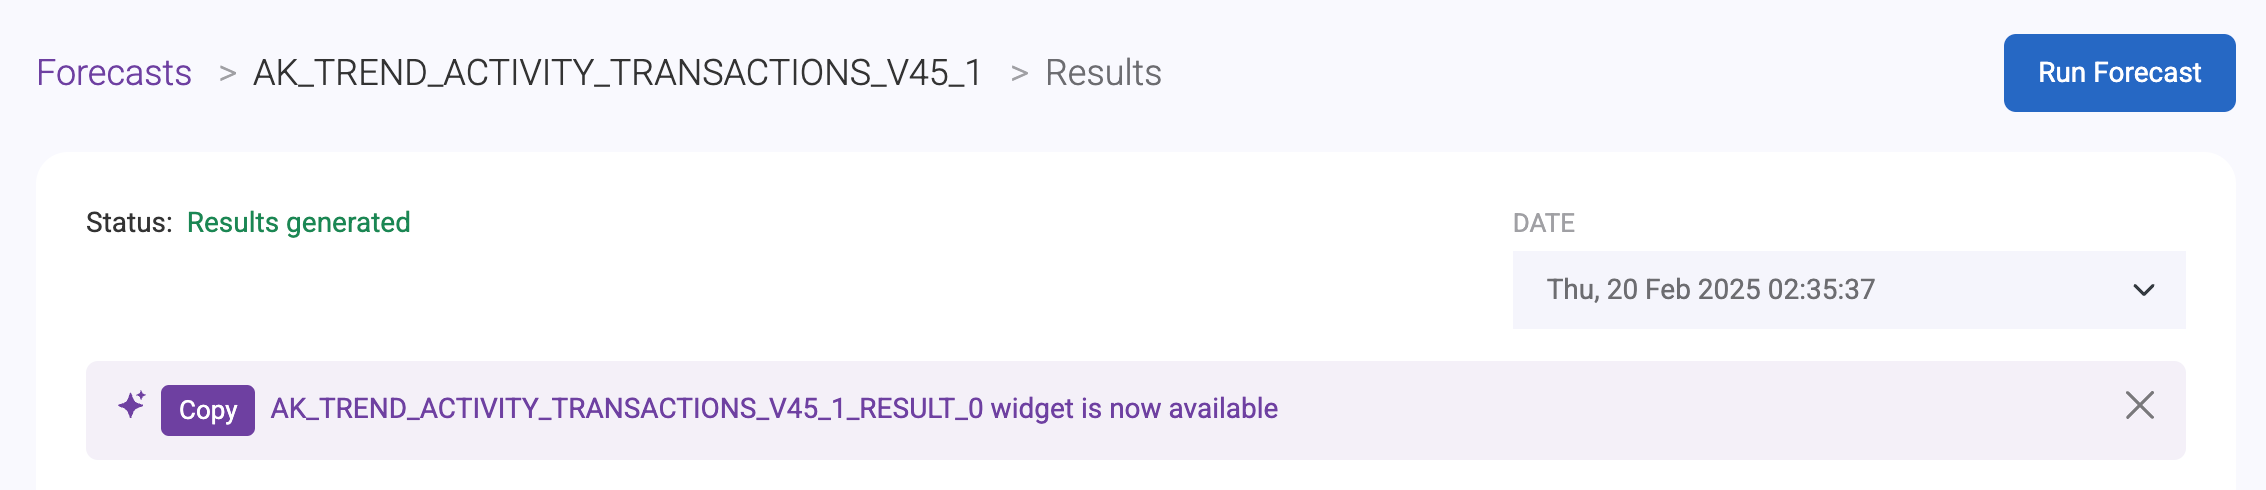
Understanding Forecast Results#
Once the results of the forecast are generated, you can view them in a grid that displays the execution date and ID, the pipeline ID, and the forecasted results of the data you wanted predicted. Consistent results require sufficient historical data, preferably a year or more. The less historical data there is, the less likely the predictions will be accurate.
Take this example of someone using Trend Forecasting to predict the Goal Hours for the Receiving task. The task and its historical data are pulled from the widget used to create the forecast. Once the forecast is run and the results are generated, the predicted Goal Hours for the activity can be seen in the results table.
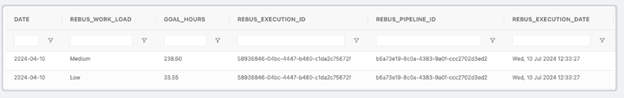
The user in this example can then use this predicted data to make decisions about their future warehouse operations. For example, if a warehouse operator notices a trend that Goal Hours are predicted higher on Fridays, they can adjust the labor scheduled for that day of the week.
Creating Forecasts#
Prerequisites#
Before you can create a forecast, you need to have or create a daily Historical Labor or Historical Demand widget. This widget must include:
a date field
a numerical field to be predicted
ideally a year’s worth of historical data
For example, you can set up a widget that contains the daily measured and goal times for a Receiving activity. For more information on how to build a custom widget, see Widget Building.
Note
 Once a widget is connected to an active forecast, you cannot modify or deactivate it. You will need to deactivate the active forecast first to make changes.
Procedure#
Steps
From the Rebus menu, select Admin Tools >AI Trend Forecasting. You’re at the AI Trend Forecasting screen.
Click ‘Create Forecast’.
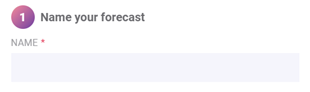
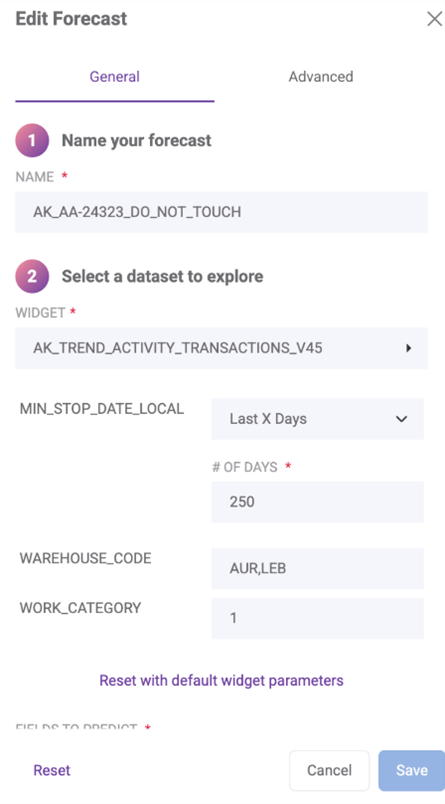
Name your forecast. In the Name field, enter a name for your forecast.
Select a dataset to explore.
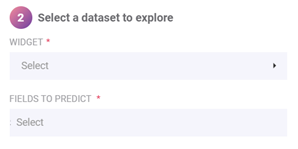
In the Widget field, select a widget from the dropdown menu, or search for the widget you want to use.
In the Fields to Predict field, select the numerical fields from the widget that you want to predict.
Select a time series.
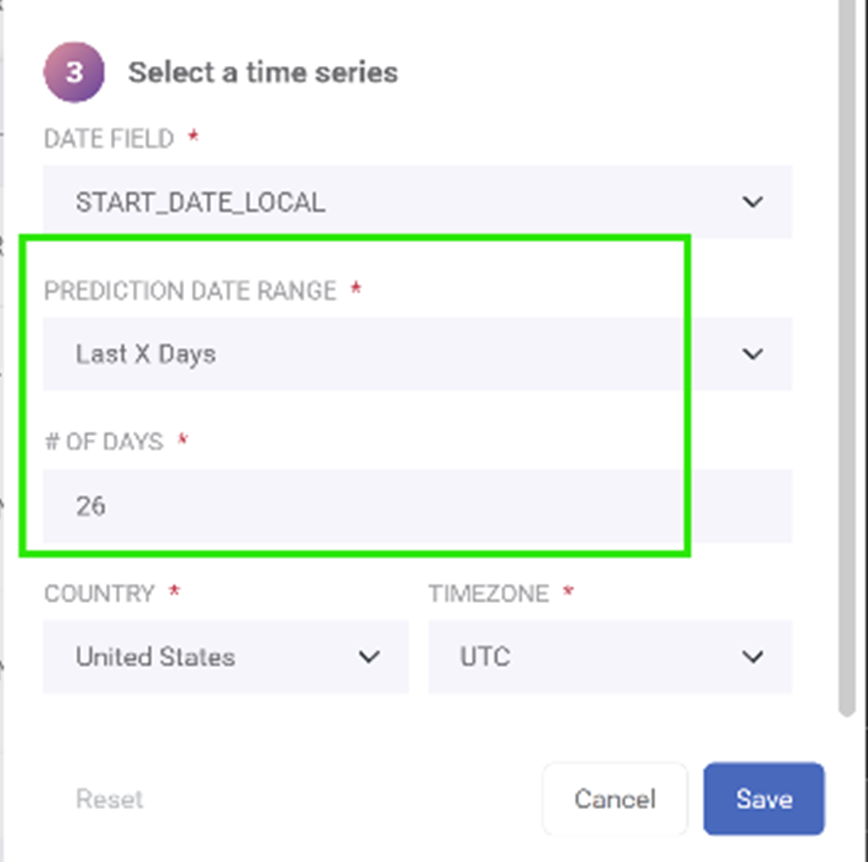
Select a DATE field from the dropdown menu.
Select from a list of future relative date ranges.
Select the country and time zone.
Click save. You can now activate your forecast, or go to the Advanced tab.
Copying/Cloning a Forecast Pipeline#
You can quickly create variations of existing forecasts without starting from the beginning by cloning existing forecasts.
Steps
From the existing forecast list, click the More button, then click Clone.
Give a name to the cloned forecast.
Make any desired edits to the forecast.
Activating a Forecast#
Once a forecast is saved, you can find it on the AI Trend Forecasting screen. In the Actions column, the following 2 or 3 action buttons display for each row:
View Results - visible only if forecast has results to display
Edit
More
Clicking on the ‘More’ dropdown button will display the following options depending on the active status of your forecast:
Status |
Possible Actions |
|---|---|
Active |
Clone, Run, Deactivate |
Inactive |
Clone, Activate, Delete |
You can activate a forecast two different ways: from the AI Trend Forecating screen, or from the forecast editing panel.
From the AI Trend Forecasting Screen#
Click the ‘Inactive’ status toggle next to your forecast name.
A confirmation window will pop up. Click ‘Yes’. Once your forecast is active, you cannot make any changes.
From here you can execute the forecast. Its status will be updated in the ‘Last Run’ column. The status updates automatically every 15 seconds.
Once results are generated, you can view your forecast results.
From the Editing Panel#
In the Edit panel, after you’ve made changes to your forecast, click the toggle next to the Run Forecast button from Inactive to Active.
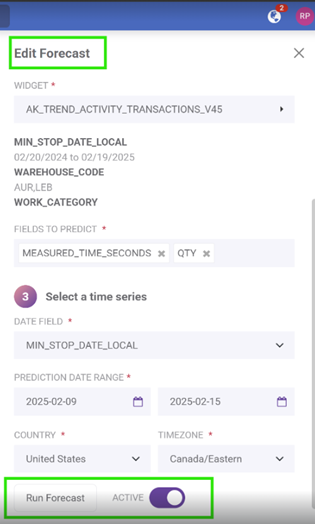
Once your forecast is active, you cannot make any changes.
Click the Run Forecast button to run the forecast. Save the edit panel.
Once results are generated, you can view your forecast results.
Editing a Forecast#
Widget Parameters#
You can override a widget’s parameter values when you edit a forecast in Trend Forecasting. In the side panel’s General tab, first select your widget, then you can modify the parameters listed. You can also reset the default widget parameters by clicking the link.
You can’t make any changes to widget parameters if a forecast is active.
Using the Advanced Tab#
The Advanced set up allows you to customize ML training and refine your forecasts. Using the Advanced tab means you have specific fields you want to filter, you want to generate multiple predictions of the same data, or you want to experiment with different features to find the most accurate prediction for your data.
Training Partitions#
In the Training Partitions section, you can separate data into distinct categories (partitions) to improve prediction accuracy. This is especially useful when different categories of data behave differently and need to be treated separately.
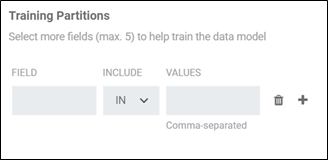
Steps
Select ‘Add Partition’.
Select the field you want to filter from the dropdown.
Select ‘IN’ to include the data and ‘NOT IN’ to exclude it.
Add the values you want to include or exclude in the Values section. Separate multiple values with a comma (ex. WH1,WH2).
You have now added a partition. You can add up to 5 total partitions.
Prediction Volume Granularity#
In the Prediction Volume Granularity section, you can generate multiple predictions of your data based on work volumes.
For example, you can generate predictions for estimated time spent on Receiving based on a low-volume, medium-volume, or high-volume day. A low-volume day is calculated based on the lowest 33% of historical data, a medium-volume day is calculated using the next 33% of historical data, and a high-volume day is calculated using the highest 33% of historical data. Similarly, you can also predict data with even more granularity, with Very Low, Low, Medium, High, Very High volumes, where historical data is separated in 20% intervals.
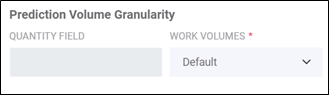
Steps
Select the quantity field you want to filter from the dropdown.
Select the Work Volume values you want predicted (Low, Medium, High or Very Low, Low, Medium, High, Very High).
In your forecast results, you will see multiple predictions for each day, depending on the different volumes selected.
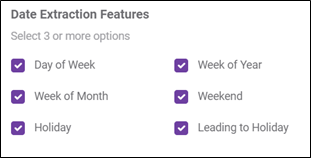
Date Extraction Features#
The Date Extraction section contains 6 automatically selected parameters that affect your end data. You must keep at least 3 of these options selected.
Parameter Selected |
Result: Trend Forecasting will take into consideration the historical trends of… |
|---|---|
Day of the week |
different days of the week. |
Week of the Month |
different weeks of the month. |
Holiday |
holidays (determined when selecting your country). |
Week of the Year |
different weeks of the year. |
Weekend |
weekends. |
Leading to Holiday |
the two days before a holiday. |
Validating a Forecast#
Validating your forecast is done by comparing forecast results with actual results. You can then adjust your forecast depending on the accuracy of your prediction.
Steps
Create a forecast. When selecting a time series, choose a date that you already have data for.
Run the forecast.
View the forecast results. Compare the forecast results with the actual data you already have.
Evaluate the forecast accuracy. Look for any major discrepancies in the data.
Based on the accuracy of the forecast, adjust the parameters set in the advanced tab if needed.
Repeat the process.
Exporting Forecast Results#
You can export your forecast results into a CSV or Excel format.
Click the new Export As button next to the Run Forecast Button on the forecast result screen.
Choose between exporting a CSV or Excel file.
The chosen file will be downloaded onto your computer.
Creating a Trend Forecasting Widget#
After you create, activate and run a forecast, you can then create a widget from your results. You can automatically generate an Insight Widget by clicking the Create an Insights Widget button.
When you automatically generate an insight widget using a forecast, there is a button that lets you copy the widget name to the clipboard.
You can then easily add it to your dashboard, where it will be marked as an Insight Widget.