Release 48.1 Notes 26 October 2025#
Summary#
In this release, we’ve developed the following improvements:
You can now do the following:
See the widget details on the Home screen through the Quick View feature,
Click to cancel the loading of a widget that is loading on your Home screen
Choose how many weeks of data you want to include in your widget filter,
Hide the date stamp underneath widget titles,
Adjust the hole size of donut pie charts in Chart Designer,
Put rounded edges on the bars of bar charts,
Set up 10 Time Components per activity type on the Activity Configuration Screen.
And this release also introduces the following changes:
Relative date filters on dashboards now return the full day’s data.
Rebus Support Centre has been moved behind the Login screen.
The Isolation Group Maintenance screen has been integrated into the User Management screen and is now accessible under the new Data Controls tab.
Widget and Dashboard Improvements#
Seeing Quick View of Home Screen Widgets#
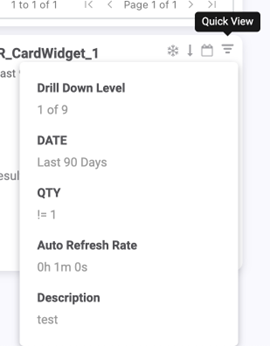
You can now see the details of a favorite widget on the Home screen through the Quick View feature. This addition to the Home screen lets you see your widget details quickly and easily.
In a way similar to the functionality on dashboards, hover over the Quick View icon in the upper right corner of the widget to view details. You will see:
Description
Auto-refresh rate,
Applied parameters, filters, and values,
Layer names (for Warehouse Map widgets),
Drill down level (for drill-down widgets)
Previously, this feature was only available on dashboards and not the Home screen.
Cancelling Loading Widgets#
You can now click to cancel a favorite widget that is loading on your Home screen. Previously, if a widget got stuck loading or was loading for a long time, you had to refresh the entire page or delete and re-add the widget and start again to stop this from happening.
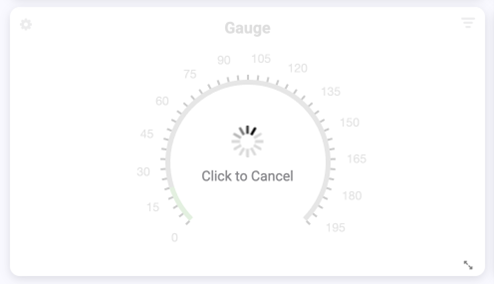
To cancel a loading widget, hover of the widget, then click the ‘Click to Cancel’ text that appears. Your widget will return to its last loaded state.
Relative Ranges Return Full Day’s Data#
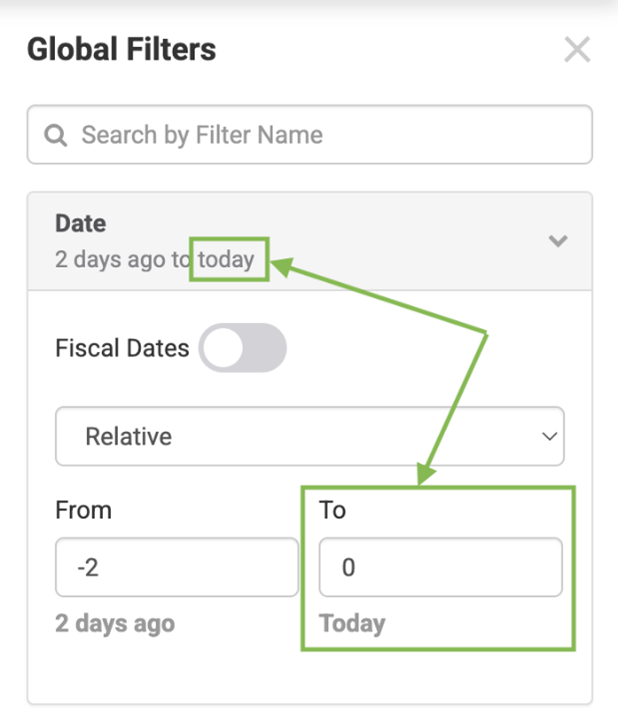
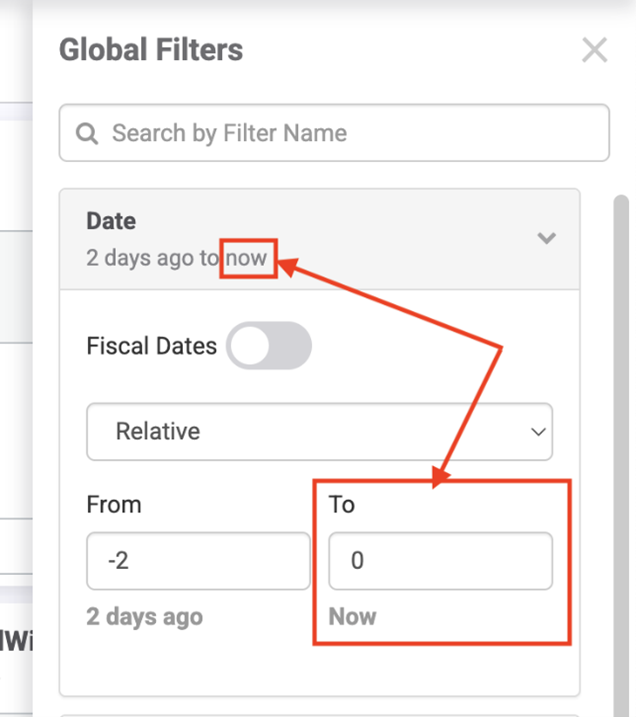
Relative date filters on dashboards now return the full day’s data. When you apply a relative date filter to a widget via Widget Properties or the Global Filters panel, data includes the full day (00:00:00 – 23:59:59). Previously, the filter would cut off at the current time of day (now), which could cause confusion and represent incomplete data.
Global Filters Now#
Global Filters Before#
Filtering Widgets by Specific Number of Weeks#
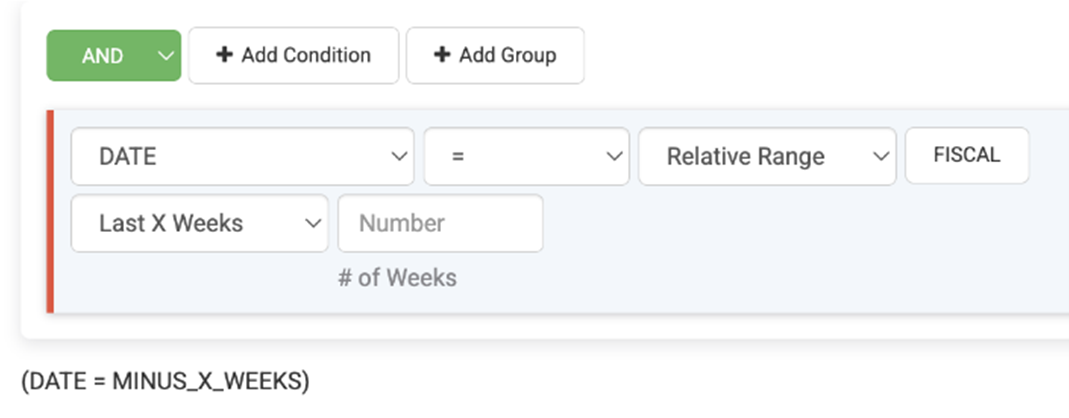
There is now a ‘Last X Weeks’ filter available in both the Global Filters panel and the Widget Properties modal on the dashboard. This feature allows you to choose how many weeks of data you want to include in your filter. Simply select the option from the dropdown, then customize both the number of weeks and the starting day of the week.
For example, if it is Wednesday, October 1, and you choose to filter the last 2 weeks and select your Start Day as Tuesday, the data returned will be from September 16-29. Note that in this example, if you set your start date as Wednesday, it will return the data from Sept 10-24. The system does not count the current day as complete and will return data starting from the previous Wednesday. The filter is also available in Widget Builder and when editing widgets.
Previously, you had to go into Widget Properties, set a custom one-week date range, and update it weekly.
Hiding a Widget’s Display Date#
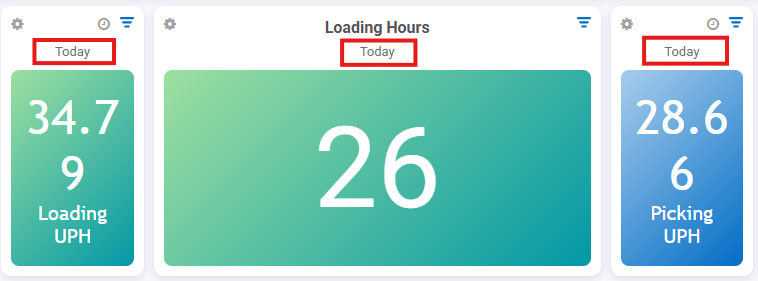
There is a new feature on the Dashboard that hides the date stamp underneath widget titles. Displaying the date beneath each widget title can sometimes be visually overwhelming, especially when you view a full dashboard with multiple components.
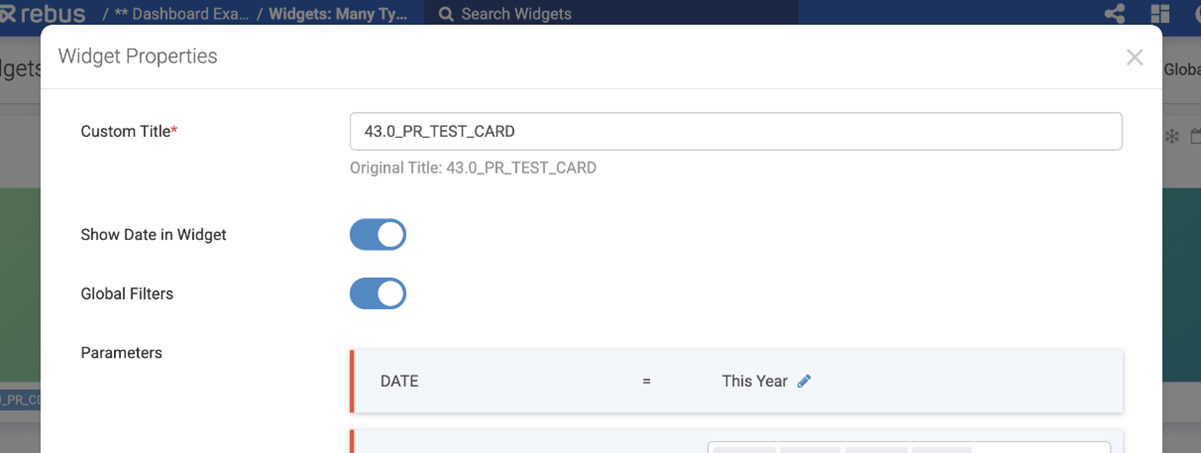
To turn off the date stamp for individual widgets, use the new On/Off toggle in the Widget Properties panel. It’s toggled on by default.
To turn off the date stamp for all widgets on a dashboard, use the new On/Off toggle in the Global Filters panel. It’s toggled on by default.

Previously, the date stamp under the widget titles on the dashboard was always visible. The date stamp tells you what date the displayed data is from- for example, Today, Last 90 Days
Chart Designer Improvements#
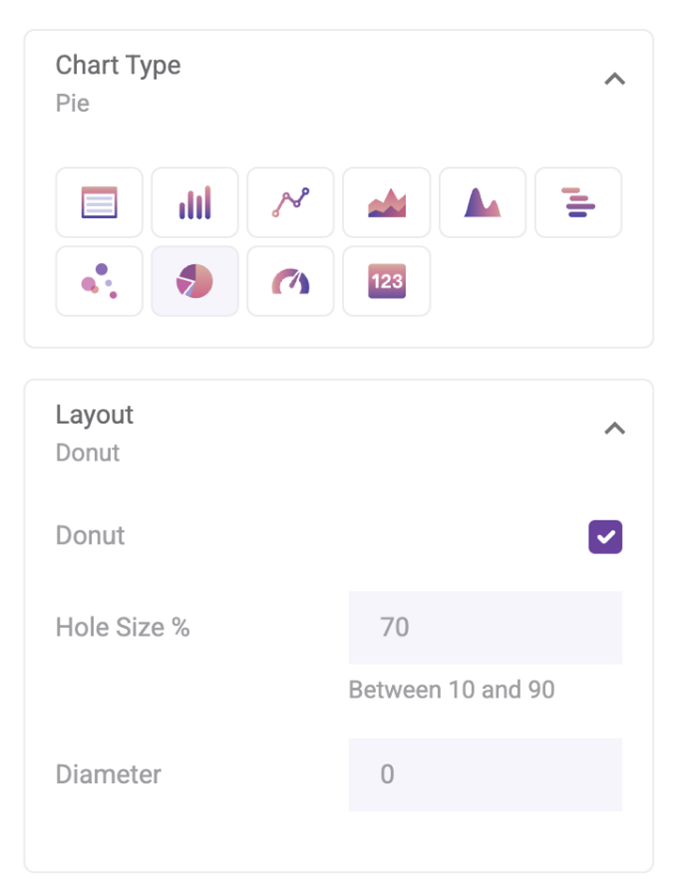
Adjusting the Hole Size of Pie Charts#
You can now adjust the hole size of donut pie charts in Chart Designer.
In the Layout section for pie charts, you’ll now find a Hole Size % field beneath the Donut checkbox. This field is automatically set to 70%, and you can adjust this to any number between 10%-90%. Increasing the number results in a larger hole size.
Previously, this was only possible by manipulating settings in the Legacy Chart Designer.
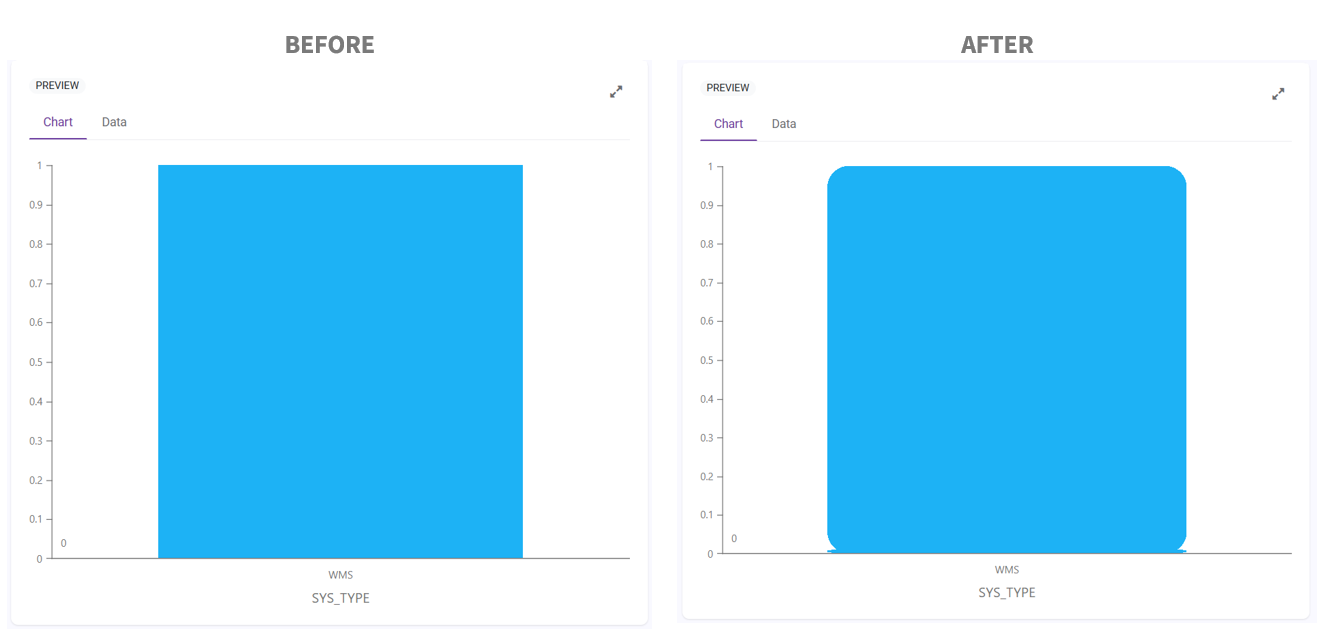
Rounded Bar Edges in Bar Charts#
In the new Chart Designer, there are two new features when you create bar charts:
Bars will no longer become invisible when their value is too small.
You can create rounded edges on your bars.
Previously, bar sizes were determined by the chart’s value scale and available space. This meant that for very small values, the bars could disappear entirely. Now, there is a minimum possible size for bars, which means they will always be visible in your chart.
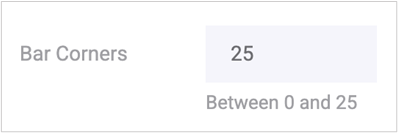
To add rounded corners to a bar chart, use the new Bar Corners field in the Layout section. Type a value between 0 and 25 to choose the roundness level of your bar corners.
Labor Improvements#
Ability to Set Up 10 Time Components#
You can now have up to 10 Time Components per activity type on the Activity Configuration Screen. Previously, you were only able to have three.
This change includes the following screens:
Transaction Error review
Activity Adjustment
Activity Configuration
Dynamic Field Configuration
A Time Component is a subset of the time it takes to complete an activity. Each time component is added to calculate a user’s expected time to complete an activity. These Time Components are used when an activity’s goal time is reprocessed.
Improvements - Other#
Help Center Documentation Moved Behind Login Page#
To keep your support resources secure and exclusive, the Rebus Help Center is now located behind the login page. You will need a valid Rebus account to access the Help Center. Your previously saved links to the Help Center now direct you to the Rebus login page before you can access the content.
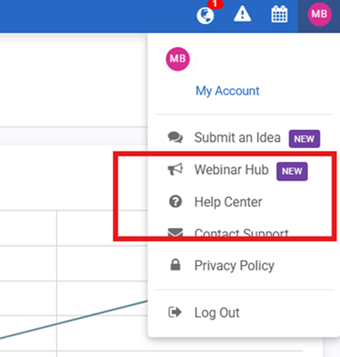
To get to the Help Center:
Log in to your Rebus account.
Navigate to the Account menu in the right-hand corner.
Click Help Center to view the latest guides, documentation, and support resources.
Isolation Groups now Set Up on User Management Screen#
The Isolation Group Maintenance screen has been integrated into the User Management screen and is now accessible under the new Data Controls tab.
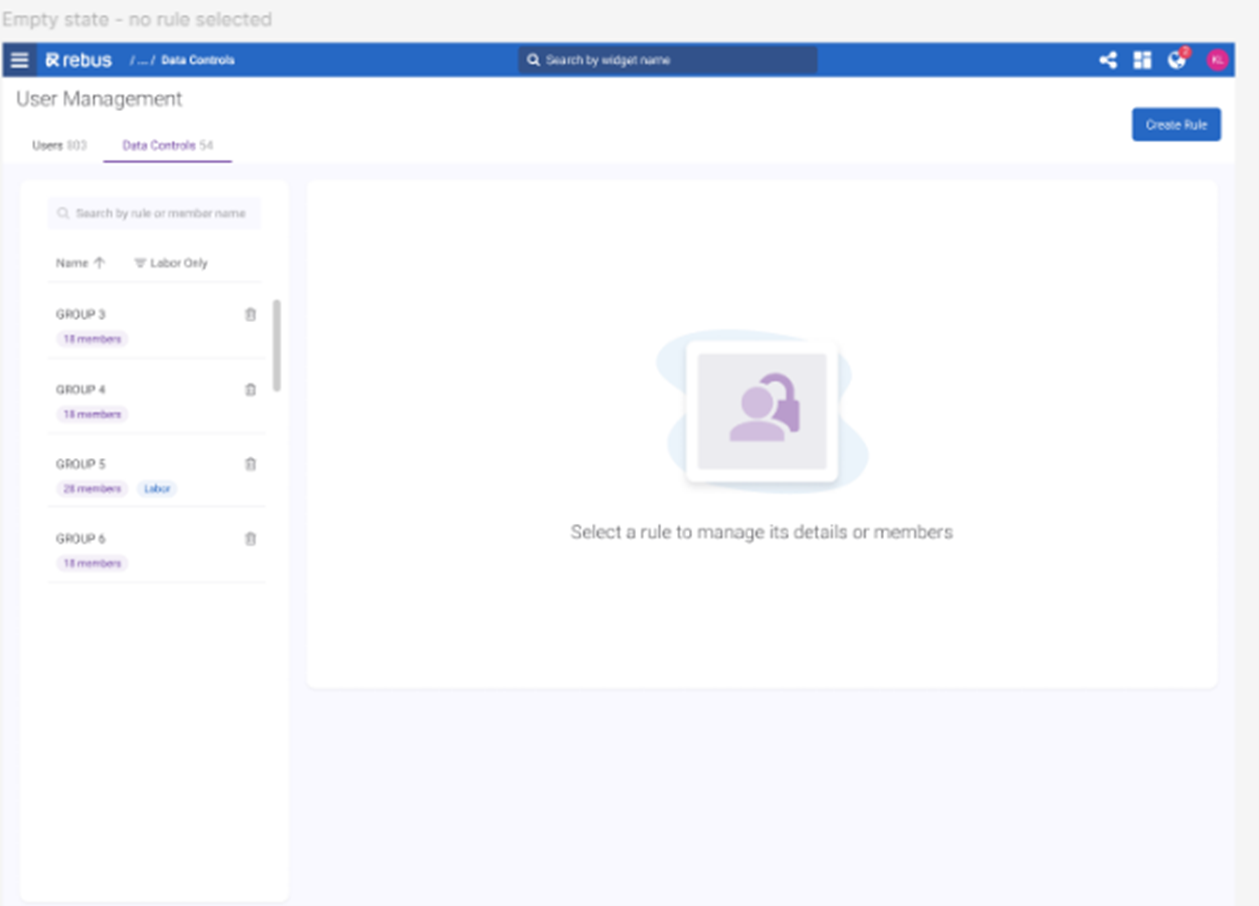
The new update lets you:
Search rules (previously known as ‘Isolation Rules’) by member
Clone an existing rule
Rename a data control after it’s been saved
See when a data control was last edited
See rules and their members side-by-side (no more switching between tabs)
View the total number of rules and the number of members belonging to each rule
Filter specifically for Labor Data rules
Identify existing duplicate rules to simplify cleanup and organization
A rule is made up of conditions, which are expressions that are evaluated to see if they’re true. Each record that’s retrieved to populate a widget is evaluated against all the conditions in the rule. Those records that evaluate as ‘true’ are what you can see.
Creating Rules#
Navigate to the new screen by going to the Rebus Menu and clicking Admin Tools>User Management>Data Controls.
Click Create Rule.
The Rule Panel opens.
Fill in the fields to create your rule.
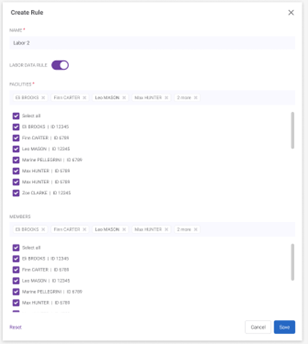
Click Save.
Editing Existing Rules#
Navigate to the new screen by going to the Rebus Menu and clicking Admin Tools>User Management>Data Controls.
Select the rule you want to edit from the lefthand menu. You can also search by member or rule name.
Change the fields you want to edit.
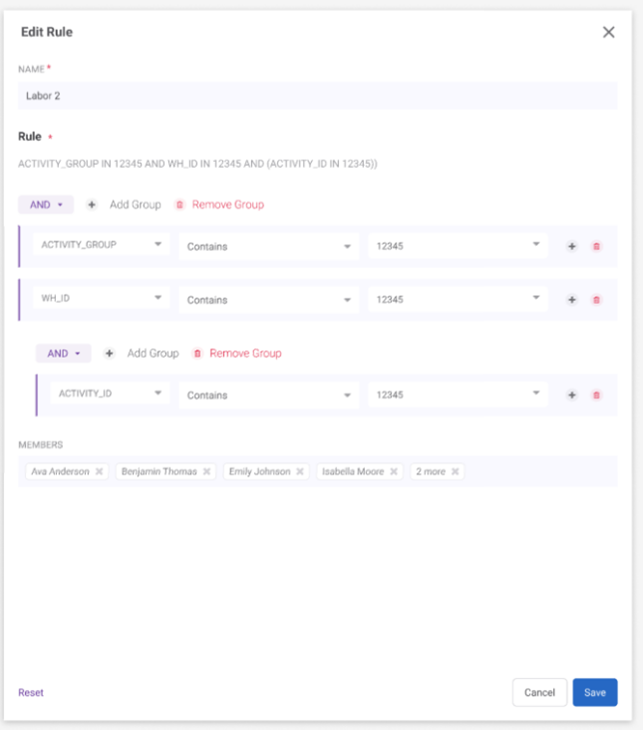
Click Save.
Managing Duplicate Rules#
When you click on a rule, you will get a warning label if it is identical to another rule in your system.
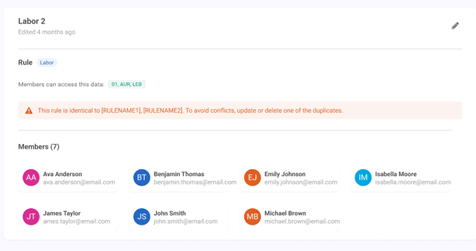
You can then either edit or delete the duplicate rule.
Bug Fixes#
Widget Builder#
Super Widgets - Run only this stage is not working if the super widgets has no added stages.
Chart Designer#
Grids - Columns should auto-reflect new order from Display Fields stage.
Pie Donut- Diameter is not getting updated.
Widgets and Dashboards#
Dashboard – Dragging and dropping any widget on the dashboard triggers a console error.
Global Filters pulling Incorrect Date Range.
Favorites Menu - Kiosk Mode does not retain Tab rotation setting after logging off.
Cascading Widgets - Unable to see the last modify date stamp in Dashboard Widgets Analyzed.
Dashboard Favorites - Warehouse Map loading continuously when a widget is added through Edit Tab.
Dashboard-Favourites- User gets console error, when non-integer values are entered for fiscal date options Month and Quarter.
Dashboard-Global Filters- User able to save non integer values in Relative Range date field.
Warehouse Map - Labels Update (Triggered by user is directed to ‘This page is having a problem’ when user selects values in layers).
Labor Module#
Labor Associates: Shift admin module - Primary shift is not syncing to labor_user fields.
Labor Associates - Shift Plan Tab: Duplicate “Sunday” option is displayed.
Change Activity - Measured/unmeasured mismatch between steps.
Other#
API- data request - Incorrect object ID validation.